Understanding Net Promoter Score (NPS)

In the world of customer experience, knowing how your customers truly feel about your brand is essential. This understanding provides the basis for growth and improvement. One of the most effective methods for gauging this sentiment is the Net Promoter Score (NPS), a valuable metric that measures customer loyalty and helps predict business growth. Let's explore what NPS is and why it's so vital for businesses of all sizes.
What is NPS?
The Net Promoter Score (NPS) boils down to a single, simple question: "On a scale of 0 to 10, how likely are you to recommend [your company/product/service] to a friend or colleague?" This seemingly basic question acts as a powerful indicator of customer loyalty, cutting through the clutter and getting to the core of how customers perceive your brand. The responses are then used to calculate your NPS, giving you a quantifiable measure of customer sentiment. This score then allows you to track customer loyalty over time and make informed decisions based on customer feedback.
Why NPS Matters
NPS isn't just a number; it's a vital sign for your company. A high NPS often correlates with increased customer loyalty, positive word-of-mouth referrals, and ultimately, higher revenue. Satisfied customers essentially become brand ambassadors, organically spreading the word about your business within their personal and professional networks. This type of organic growth is incredibly valuable in today's competitive market. Furthermore, understanding your NPS can reveal critical insights into the overall health of your customer relationships, setting the stage for more strategic improvements.
Additionally, NPS can highlight areas where your business can improve. Low scores can point to weaknesses in your customer experience, providing valuable feedback that you can use to refine your strategies. For instance, a consistently low NPS might indicate issues with customer service or product quality. This feedback loop enables proactive changes to improve customer satisfaction and address underlying problems. This continuous improvement process is what makes NPS such a powerful tool for long-term growth.
The Three Categories of NPS
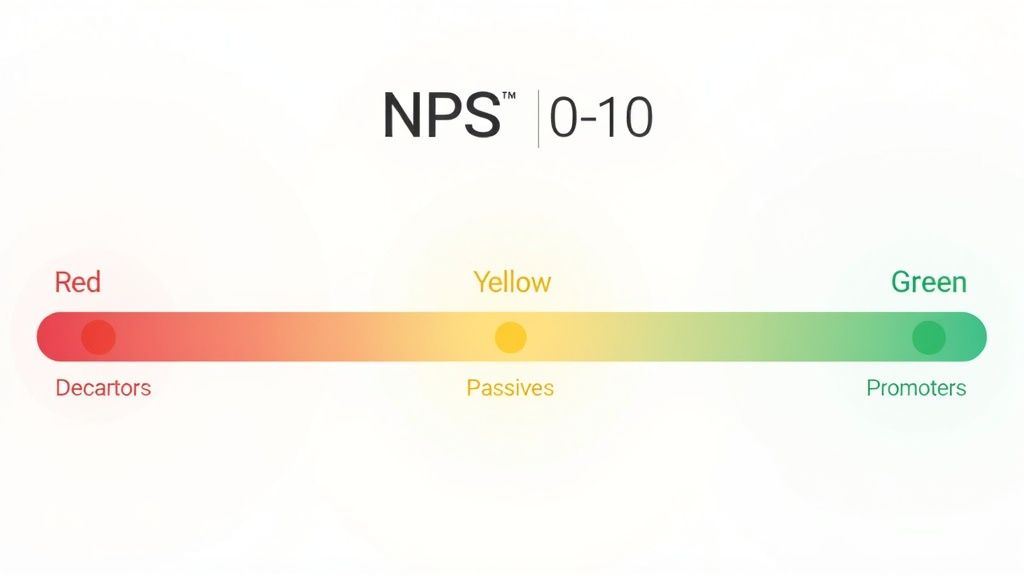
Understanding NPS involves recognizing the three customer categories it defines: Promoters, Passives, and Detractors. Promoters (those who give a 9 or 10) are your enthusiastic fans, actively recommending your brand. Passives (scoring 7 or 8) are satisfied but not necessarily loyal, leaving them open to competitor offerings. Finally, Detractors (0-6) represent unhappy customers who might actively discourage others from using your product or service. This categorization allows you to segment your customer base and tailor your approach to each group. Addressing the concerns of Detractors can be just as important as nurturing the enthusiasm of Promoters. This nuanced view of customer sentiment leads us to the next section, where we’ll explore how the NPS is calculated.
The NPS Formula Explained

As we've discussed, the Net Promoter Score (NPS) revolves around the "likelihood to recommend" question. But how do individual responses translate into a single, actionable score? This section breaks down the NPS formula step by step, revealing how this simple calculation provides powerful insights.
Grouping Your Responses
The first step in calculating NPS involves categorizing responses into the three groups: Promoters, Passives, and Detractors. Recall that Promoters (9-10) are enthusiastic and loyal, Passives (7-8) are satisfied but not actively promoting, and Detractors (0-6) are unhappy. This categorization forms the foundation of your NPS calculation. A large number of Promoters suggests strong brand advocacy, while a high number of Detractors signals potential problems that require attention. This initial grouping provides a clear picture of your customer sentiment distribution.
Calculating the Percentages
After grouping the responses, the next step is calculating the percentage of respondents in each category. This involves dividing the number of respondents in each group by the total number of respondents and then multiplying by 100. For example, if you have 100 responses and 50 are Promoters, your Promoter percentage would be 50%. These percentages are essential for the final NPS calculation. They provide the proportional representation needed to understand the balance between your customer categories.
The Final Calculation: Formula for Net Promoter Score
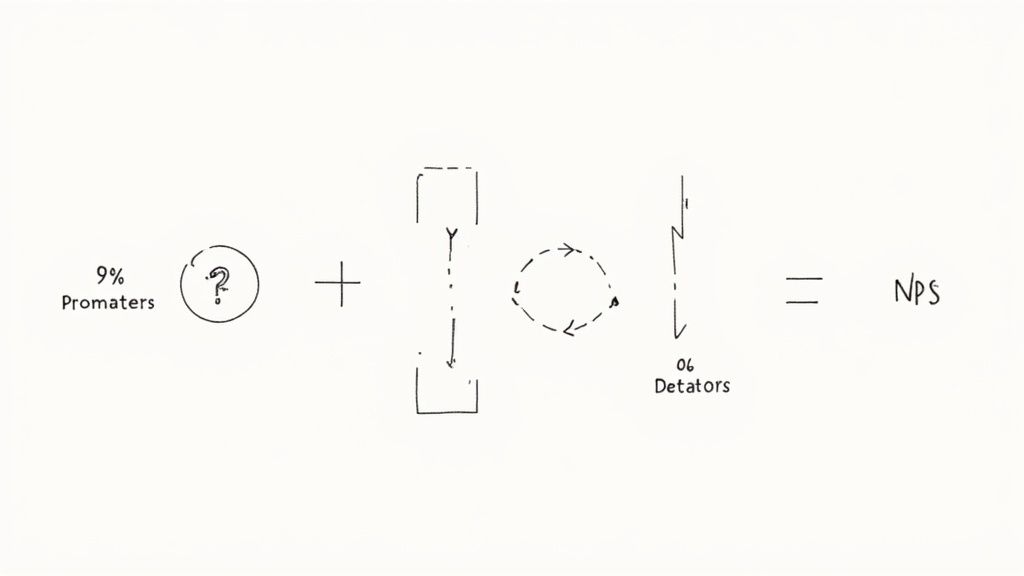
The NPS formula itself is straightforward: subtract the percentage of Detractors from the percentage of Promoters. The result is a score ranging from -100 to +100. A negative NPS means you have more Detractors than Promoters, while a positive NPS indicates more Promoters. For instance, if you have 70% Promoters and 10% Detractors, your NPS is 60 (70% – 10% = 60). This final number is your Net Promoter Score, a key indicator of customer loyalty. This seemingly simple calculation unveils a wealth of information about the health of your customer relationships.
Understanding Your Score
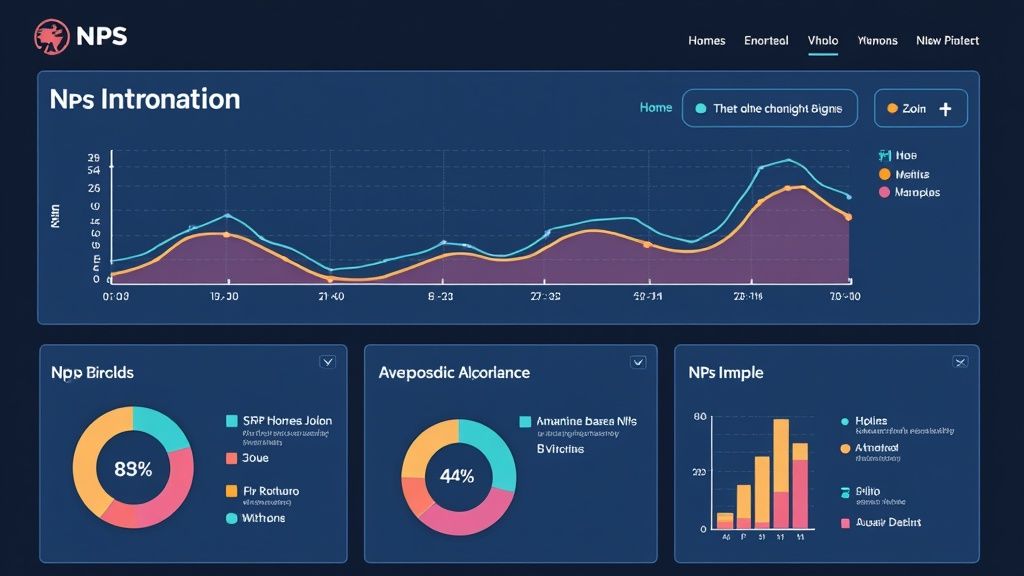
Now that you understand how to calculate your NPS, what does the score actually tell you? A higher score generally signifies stronger customer loyalty, but the interpretation also depends on your specific industry. A score of 30 might be exceptional in one industry but average in another. More importantly, tracking your NPS over time, rather than just comparing it to industry benchmarks, allows you to gauge the effectiveness of your customer experience initiatives. This internal tracking provides valuable data-driven insights for enhancing customer satisfaction and building stronger customer relationships, leading to sustainable business growth.
Collecting NPS Data
Having covered the NPS formula and its importance, let's explore how to gather the necessary data. Collecting reliable NPS data depends on asking the right questions at the right time and utilizing appropriate tools. This section delves into the best practices for gathering customer feedback.
Choosing the Right Survey Method
The first step in collecting NPS data is selecting the most appropriate survey method. Various options exist, each with advantages and disadvantages. Email surveys allow you to reach a broad audience, but response rates can be a challenge. In-app surveys offer higher engagement, especially for software products, as they appear directly within the user interface. SMS surveys provide a direct and immediate channel, making them suitable for time-sensitive feedback. The optimal method depends on your target audience and the type of feedback you seek. For instance, SMS is ideal for quick feedback after a specific interaction, while email or in-app surveys are better suited for more detailed feedback.
Timing is Everything
The timing of your NPS survey is just as critical as the method. Asking the "likelihood to recommend" question at the right moment can significantly influence response rates and the quality of feedback. Surveying immediately after a positive interaction, like a purchase or a resolved support issue, might lead to higher scores, but it might not capture the full customer experience. Conversely, excessive surveying can lead to survey fatigue and lower response rates. Finding the right balance involves strategically triggering surveys based on key customer actions or milestones in their journey. This ensures you're collecting feedback at relevant points without overwhelming your customers.
Ensuring High Response Rates
Low response rates can skew your NPS calculations and misrepresent your customer base. Several strategies can help improve participation. Keeping surveys short and to the point is crucial. Clearly explaining the survey's purpose and how the feedback will be used can encourage responses. A small incentive, like a discount or raffle entry, can also be effective, but use them carefully to avoid biased responses. The ultimate goal is to make providing feedback valuable for both the customer and your company. By maximizing participation, you gather more accurate data for calculating and interpreting your NPS.
Analyzing NPS Results

Calculating your NPS is just the beginning. The true value lies in analyzing the results and using them to enhance your customer experience. This section explains how to interpret your NPS data and transform insights into action.
Beyond the Number: Understanding the Context
While the NPS formula provides a single number, it's essential to consider the broader context. A score of 20 might appear decent, but it could be concerning if it represents a decline from a previous score of 40. Comparing your score to industry benchmarks can be helpful, but it shouldn't be your sole evaluation method. Focusing on trends within your own data allows you to pinpoint your successes and areas for improvement. This internal focus provides a more accurate and actionable perspective.
Segmenting Your Audience for Deeper Insights
Calculating your overall NPS is a good starting point, but segmenting your audience provides a more granular understanding. Apply the NPS formula to specific customer groups based on demographics, purchase history, or product usage. You might discover, for instance, that your NPS is significantly lower among newer customers. This could indicate issues with the onboarding process or initial product experience. Segmenting provides targeted insights for enhancing specific aspects of the customer journey.
Qualitative Data: The Voice of Your Customer
While NPS offers a quantitative measure, qualitative data is equally important. Encourage customers to provide open-ended feedback along with their numerical rating, allowing them to elaborate on their experiences. This feedback provides invaluable context, revealing specific pain points and the drivers of both satisfaction and dissatisfaction. A Detractor might highlight a frustrating product feature, while a Promoter might praise a specific aspect of your service. This combination of quantitative and qualitative data creates a holistic understanding of the customer experience.
Turning Insights into Action: Closing the Feedback Loop
Analyzing NPS results is only valuable if it leads to concrete action. Identify specific initiatives to address weaknesses and build on strengths. For example, if feedback reveals consistent complaints about customer support wait times, consider implementing tools like SupportMan to streamline your support operations and improve response times. SupportMan integrates Intercom ratings directly into Slack, providing real-time insights and enabling rapid response to customer feedback. This proactive approach demonstrates that you value customer feedback and are actively working to improve their experience, closing the feedback loop and strengthening customer relationships.
Improving Your NPS Score

You've calculated your NPS, gathered data, and analyzed the results. Now, how do you actually improve it? A high NPS isn't a final destination; it's a continuous journey of improvement. This section explores actionable strategies to boost customer satisfaction and elevate your NPS.
Addressing Detractor Concerns
Focusing on your Detractors – those who gave you scores between 0 and 6 – is crucial. While it’s tempting to concentrate on pleasing your Promoters, addressing Detractor concerns offers significant value. These are not just unhappy customers; they represent valuable learning opportunities. By reaching out to Detractors, you can uncover specific issues and implement targeted improvements. This can not only improve your NPS but also potentially convert Detractors into Passives, or even Promoters. Proactively addressing negative feedback demonstrates a strong commitment to customer satisfaction.
Empowering Your Support Team
Your support team plays a vital role in shaping customer perception. Equipping them with the right tools and training can significantly impact customer satisfaction. For example, platforms like SupportMan can streamline support processes and empower your team to respond to feedback effectively. Integrating Intercom ratings directly into Slack, as SupportMan does, provides real-time insights and enables proactive responses, turning potential Detractors into satisfied customers by addressing issues quickly and efficiently.
Creating a Customer-Centric Culture
Improving your NPS isn't about quick fixes; it’s about creating a customer-centric culture across your entire organization. Every department, from product development to marketing, should prioritize understanding and meeting customer needs. If product development integrates customer feedback into the design process, the resulting product is more likely to meet expectations, leading to higher satisfaction and a better NPS. This holistic approach ensures a positive customer experience at every touchpoint.
Going the Extra Mile
While meeting expectations is essential, exceeding them fosters truly memorable experiences and loyalty. This could involve small gestures like personalized thank you notes or unexpected discounts. These acts of appreciation can significantly impact customer perception and boost your NPS. For instance, offering a free service month to a customer who experienced a service disruption not only resolves the issue but also demonstrates a strong commitment to customer satisfaction, building stronger relationships and promoting long-term loyalty. Remember, improving your NPS is an ongoing process of listening, learning, and adapting.
Common NPS Mistakes to Avoid
Now that we've covered the formula for NPS, its calculation, analysis, and improvement strategies, let's look at some common pitfalls to avoid. Even the best NPS initiatives can fall short if not implemented correctly. Avoiding these mistakes ensures you’re getting accurate and actionable insights from your NPS program.
Overlooking the "Why"
A major mistake is focusing solely on the NPS number without understanding the reasons behind it. A low NPS indicates a problem, but without understanding the “why,” solutions are difficult to develop. A drop in your NPS could be due to various factors, like a product bug, a pricing change, or even external factors like a competitor’s promotion. Qualitative data provides valuable context, helping pinpoint the root causes of dissatisfaction and enabling you to address them effectively.
Surveying Too Frequently or Infrequently
Finding the right survey frequency is important. Too many surveys can lead to survey fatigue, while too few can prevent you from catching emerging issues quickly. The ideal frequency depends on your industry and customer lifecycle. A SaaS company might survey monthly, while a retailer might survey quarterly. The key is to collect meaningful data without overwhelming your customers.
Ignoring Passives
While the NPS formula emphasizes the difference between Promoters and Detractors, ignoring Passives is a missed opportunity. These satisfied but not actively promoting customers are vulnerable to competitors. Understanding their needs is crucial for growth. Asking Passives a follow-up question like, “What could we do to improve your experience?” can provide valuable insights and help convert them into Promoters, strengthening customer loyalty and boosting your NPS.
Ready to turn customer feedback into actionable insights? Try SupportMan today and see how integrating Intercom ratings directly into Slack can transform your support operations and boost your NPS. Start your free trial now – no credit card required! https://supportman.io


