In today’s competitive business world, exceptional customer service is essential for success. It builds customer loyalty, generates positive word-of-mouth, and drives sustainable growth. But how can you ensure your customer service truly excels? The answer lies in measurement, and that’s where Key Performance Indicators (KPIs) come in. They provide crucial insights into the health and effectiveness of your customer service operations.
Think of KPIs as the vital signs of your customer service. They help you understand what’s working and what needs improvement. From simple customer feedback cards to sophisticated analytics dashboards, the methods for evaluating customer service have evolved significantly. The digital age, with its instant feedback and abundance of data, has transformed how we understand and improve customer interactions. What was once anecdotal is now quantifiable, enabling businesses to identify strengths and weaknesses with greater precision.
Choosing the right KPIs is critical. These metrics should align with your specific business goals and provide actionable information. This means understanding not only what to measure but also why. An effective KPI strategy focuses on metrics that directly impact your bottom line and customer satisfaction.
Understanding the Core Metrics
This article will guide you through the essential KPIs that drive customer service excellence. You’ll learn how to use these metrics to identify areas for improvement, optimize support strategies, and build a customer-centric culture that fuels business growth. We’ll explore core metrics that provide a comprehensive view of your customer service performance.
- First Contact Resolution: This measures how often customer issues are resolved on the first interaction.
- Customer Satisfaction (CSAT): This gauges how satisfied customers are with their overall experience.
- Net Promoter Score (NPS): This measures customer loyalty and their likelihood to recommend your business.
By focusing on these and other key metrics, you can unlock the power of data-driven decision-making and take your customer service to the next level.
1. First Contact Resolution (FCR)

First Contact Resolution (FCR) is a critical customer service KPI. It directly correlates with customer satisfaction and operational efficiency. FCR measures the percentage of customer inquiries resolved on the first interaction, eliminating the need for further contact. A high FCR demonstrates an effective support process, leading to increased customer loyalty and reduced costs.
FCR essentially tracks how well you resolve customer issues in a single interaction. You can measure FCR across different channels like phone, email, and live chat, giving you a comprehensive view of your support performance. Calculating FCR is usually simple: divide the number of issues resolved on the first contact by the total number of issues handled.
Why FCR Matters
- Enhanced Customer Satisfaction and Loyalty: Quickly and efficiently resolving issues creates a positive customer experience. This fosters loyalty and encourages positive word-of-mouth referrals.
- Reduced Operational Costs: Fewer follow-up contacts mean agents spend less time on the same issue. This frees up resources and lowers expenses.
- Targeted Training Opportunities: FCR data can reveal areas where agents need more training or resources. This leads to improved performance and higher resolution rates.
- Process Improvement: Low FCR rates can indicate inefficiencies in the support process, like an inadequate knowledge base. This can prompt improvements for smoother operations.
Pros of Tracking FCR
- Directly improves customer satisfaction and loyalty
- Reduces operational costs by minimizing repeat contacts
- Pinpoints training needs for service representatives
- Reveals process inefficiencies that hinder quick resolutions
Cons of Tracking FCR
- Can be challenging to track accurately across all channels
- Might encourage representatives to rush solutions instead of addressing root causes
- Doesn’t consider the varying complexity of different issues
- The meaning of “resolved” can be open to interpretation
Real-World Examples
- Amazon: Known for its customer-centric approach, Amazon achieves impressive FCR rates. They empower agents with the tools and information needed to resolve issues immediately. This allows agents to handle various situations without escalation.
- Zappos: Zappos prioritizes FCR by eliminating time limits on calls. This lets representatives fully address customer needs and own the issue until resolution. This focus contributes to their excellent customer service reputation.
Tips for Improving FCR
- Confirm Resolution: Use post-interaction surveys. Gather direct customer feedback and confirm issue resolution.
- Knowledge is Power: Build comprehensive, accessible knowledge bases. Help agents quickly find information to address common inquiries.
- Targeted Analysis: Track FCR by issue type to pinpoint specific improvement areas. Tailor training accordingly.
- Agent Empowerment: Give agents the authority to make decisions and offer immediate solutions without escalation.
History and Popularization
Organizations like The Service Quality Measurement Group (SQM) and the Customer Contact Council popularized the FCR concept. They recognized its importance for customer satisfaction and operational efficiency. Their research and advocacy solidified FCR as a vital customer service metric.
By prioritizing FCR, businesses create a better customer experience, streamline their operations, and improve their bottom line. FCR is an essential KPI for any organization focused on exceptional customer service.
2. Customer Satisfaction Score (CSAT)
Customer Satisfaction Score (CSAT) is a key performance indicator (KPI) that measures how happy your customers are with a specific interaction, product, or service. It’s a vital metric for businesses that prioritize excellent customer experiences, offering direct, actionable feedback. Its importance is underscored by its simplicity, widespread use, and ability to identify areas for improvement in customer service.
CSAT is typically gathered through short surveys, often immediately after an interaction. Customers rate their satisfaction on a scale, usually from 1-5 or 1-10. This simplicity makes it easy for customers to understand and respond quickly.
Key Features of CSAT
- Scaled Measurement: Typically a 5-point or 10-point scale.
- Customization: Adaptable to various touchpoints in the customer journey. Examples include after a purchase, support interaction, or website visit.
- Percentage Presentation: Often presented as the percentage of customers who selected the top scores (e.g., 4 or 5 on a 5-point scale).
- Real-time Insights: Can be collected immediately after interactions, providing immediate feedback.
Pros of Using CSAT
- Simple and User-Friendly: Easy to understand and complete, leading to higher response rates.
- Specific Feedback: Offers targeted insights into specific interactions or services.
- Easy Implementation: Deployable across multiple channels such as email, SMS, and websites.
- Quick Identification of Issues: Allows for rapid detection of service problems.
- Segmentation Capabilities: Data can be segmented by product, service, or even individual customer service representatives.
Cons of Using CSAT
- Response Bias: Prone to feedback mainly from extremely satisfied or dissatisfied customers, which can skew results.
- Limited Scope: May not accurately reflect long-term customer loyalty or overall brand perception.
- Cultural Influences: Rating scales can be interpreted differently across cultures, affecting comparability.
- Lack of Depth: Doesn’t always provide context or explain the reasoning behind customer ratings.
Real-World Examples
- Apple: Gathers CSAT scores after every Genius Bar appointment and technical support interaction to maintain high-quality service and address immediate concerns.
- Hilton Hotels: Uses CSAT surveys after guest stays to evaluate service quality, identify areas for improvement, and enhance the overall guest experience.
Tips for Effective CSAT Implementation
- Brevity is Key: Keep surveys short and focused on the specific interaction.
- Timely Delivery: Request feedback right after the interaction while the experience is fresh.
- Follow-Up Action: Address negative scores to understand the reasons for dissatisfaction and take corrective action.
- Data Segmentation: Segment CSAT data by customer demographics, issue type, and service channel for detailed insights.
- Qualitative Insights: Combine CSAT surveys with open-ended questions for richer feedback and understand the reasons behind the ratings.
Evolution and Popularization
The American Customer Satisfaction Index (ACSI) significantly influenced CSAT’s rise as a crucial business metric. Companies like Zendesk and Salesforce further integrated CSAT into their customer service platforms, boosting its accessibility and adoption.
By effectively using CSAT, businesses can proactively address customer issues, improve service, and ultimately boost customer loyalty and business growth.
3. Net Promoter Score (NPS)
Net Promoter Score (NPS) is a well-known metric used to measure customer loyalty and how likely they are to recommend a company’s products or services. Its simplicity and purported link to business growth have made it a key element of customer experience management. At its core, NPS comes down to a single question: “How likely are you to recommend our company to a friend or colleague?”
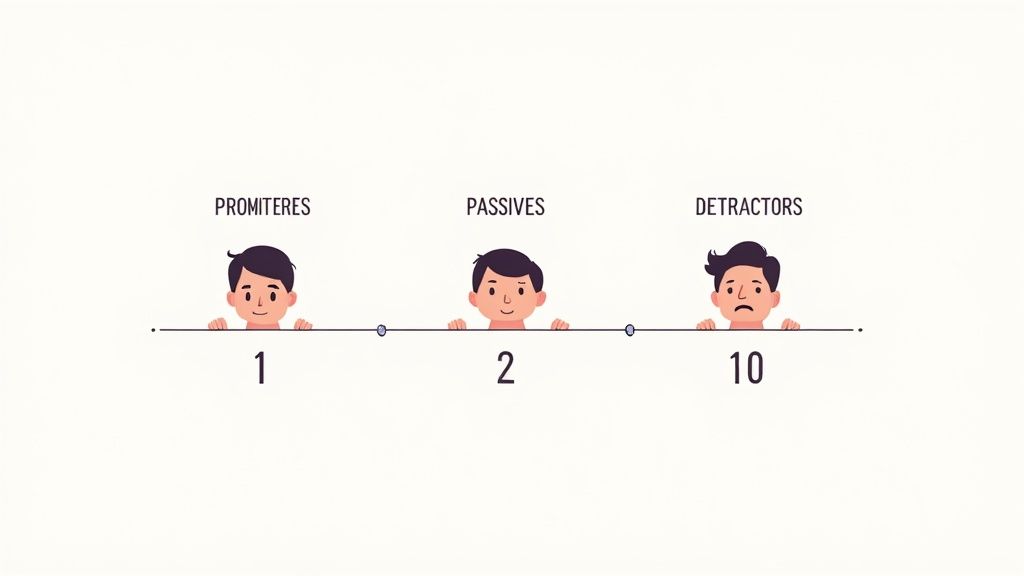
Respondents answer using a scale of 0 to 10 and are grouped into three categories:
- Promoters (9-10): These enthusiastic customers are likely to spread positive word-of-mouth and contribute to business growth.
- Passives (7-8): While satisfied, passives aren’t necessarily loyal and might be swayed by competitors.
- Detractors (0-6): Unhappy customers who may actively discourage others from using your products or services.
The NPS score is calculated by subtracting the percentage of Detractors from the percentage of Promoters, resulting in a score between -100 and +100. A higher score indicates a larger proportion of loyal customers.
Why NPS Is Important
Its simplicity and emphasis on customer advocacy make NPS a valuable tool for understanding overall customer sentiment and growth potential. It’s an easily understood metric for executives and stakeholders to track and compare performance against competitors.
Features and Benefits
- Simple 0-10 Scale: Easy for customers to understand and answer.
- Clear Customer Categorization: Provides practical insights into customer segments.
- Follow-Up Questions: Allows for a more in-depth understanding of customer opinions.
- Transactional and Relational Measurement: Captures feedback across different touchpoints.
- Identifies Brand Advocates: Helps capitalize on positive word-of-mouth marketing.
Pros and Cons of Using NPS
The benefits of using NPS are numerous, but it does also have some drawbacks.
Pros
- Correlation with Growth: Research suggests a connection between high NPS and increased revenue.
- Easy to Collect and Calculate: Simplifies data collection and analysis.
- Industry Benchmarking: Provides context for comparing performance.
- Clear Metric for Stakeholders: Makes communication and alignment easier.
Cons
- Limited Detailed Insights: Doesn’t, on its own, identify specific areas for improvement.
- Cultural Differences: Scoring trends may vary across cultures.
- Oversimplification: Using a single metric might not capture the complete picture of customer relationships.
Real-World Examples
- Apple: Consistently maintains NPS scores over 70, demonstrating strong customer loyalty.
- USAA: Known for exceptional customer service, USAA often achieves NPS scores in the 80s.
History and Growth of NPS
NPS was made popular by Fred Reichheld of Bain & Company, particularly through his 2003 Harvard Business Review article, “The One Number You Need to Grow,” developed in conjunction with Satmetrix. Although debated, its ease of use and purported connection to growth have made it a widely used metric.
Practical Tips for Using NPS
- Regular Surveys: Track changes and identify shifts in customer sentiment.
- Open-Ended Follow-Up Questions: Understand the reasons behind customer scores.
- Segmentation: Analyze NPS by demographics, product lines, or service channels.
- Address Concerns: Contact detractors to resolve issues and improve their experience.
- Create Action Plans: Develop focused initiatives based on feedback themes.
By understanding NPS, its strengths and weaknesses, and using it effectively, businesses can gain valuable insights into customer loyalty and promote growth.
4. Average Handle Time (AHT)
Average Handle Time (AHT) is a key performance indicator (KPI) that reveals how efficiently your customer service team operates. It measures the average duration of a complete customer interaction, encompassing talk time, hold time, and any work done after the call. Tracking and analyzing AHT helps organizations understand resource allocation, pinpoint areas for improvement, and deliver service more efficiently without compromising quality. While traditionally associated with call centers, AHT is increasingly relevant across all customer service channels, including chat, email, and social media.
How Is AHT Calculated and What Does It Include?
AHT is calculated by dividing the total handle time for all interactions by the total number of interactions handled. This includes:
- Talk/Engagement Time: The time spent directly interacting with the customer.
- Hold Time: The time the customer spends on hold.
- Post-Interaction Processing: The time spent after the interaction on tasks like updating records or scheduling follow-ups.
This metric can be broken down further for more detailed analysis. You can assess AHT by representative, team, issue type, or channel. This granular view helps identify specific opportunities for improvement. AHT is typically measured in minutes or seconds.
Why AHT Matters: Pros and Cons
AHT offers several benefits for businesses aiming to optimize customer service:
- Cost Optimization: Directly impacts staffing and operational costs. Lower AHT can mean fewer agents needed.
- Efficiency Gains: Helps identify bottlenecks and inefficiencies in service delivery.
- Workload Forecasting: Enables more accurate workload forecasting and better staffing schedules.
- Training Needs Identification: Shows where agents might need more training or resources.
However, overemphasizing AHT can have drawbacks:
- Reduced Service Quality: Pressuring agents to lower AHT can rush interactions and reduce customer satisfaction.
- Oversimplification of Issues: AHT doesn’t account for the complexity of various customer issues.
- Discouragement of Thoroughness: Using AHT alone can penalize agents who take the time to fully resolve complex issues.
- Conflict with Other Metrics: Focusing only on AHT can negatively affect other important metrics, like First Contact Resolution (FCR), if not balanced carefully.
Real-World Examples and Tips for Improvement
Companies like Zendesk and T-Mobile have successfully improved AHT to enhance customer service. Zendesk reduced AHT by 15% using AI-powered knowledge suggestions for faster information access. T-Mobile improved both AHT and customer satisfaction by creating specialized teams for different issue types.
Here are some tips for effective AHT implementation:
- Balance with Quality: Always consider quality metrics like Customer Satisfaction (CSAT) and FCR alongside AHT.
- Analyze Outliers: Investigate unusually high or low AHT instances to identify process improvement opportunities.
- Segmentation: Segment AHT by issue type to set realistic targets.
- Focus on Hold Time and Knowledge Access: Prioritize minimizing hold time and giving agents better access to knowledge bases.
- Leverage Speech Analytics: Use speech analytics to pinpoint common time-consuming issues that could be addressed with self-service options.
Evolution and Importance
AHT gained prominence in the call center industry, standardized by organizations like COPC Inc. and the International Customer Management Institute (ICMI). As customer service channels expanded, AHT became a key metric for measuring efficiency across various interactions.
AHT provides invaluable insight into operational performance. By understanding and utilizing AHT effectively, businesses can optimize resource allocation, identify areas for improvement, and ultimately deliver a faster, more efficient, and more satisfying customer experience.
5. Customer Effort Score (CES)
Customer Effort Score (CES) measures how easy it is for customers to interact with your business and resolve their issues. Unlike metrics that gauge customer satisfaction or delight, CES focuses on the practical aspects of the customer journey. It typically asks a simple question, often phrased as “How easy was it to get your issue resolved?”, using a 5 or 7-point scale ranging from “very difficult” to “very easy.” This focus on effort stems from research demonstrating that reducing customer effort is a stronger predictor of loyalty and repeat purchases than exceeding expectations.
This emphasis on practicality makes CES a valuable Key Performance Indicator (KPI). It provides a clear, actionable metric that directly correlates with customer loyalty. By identifying pain points and friction in the customer journey, businesses can prioritize improvements with the greatest impact on the overall customer experience. This makes it more actionable than traditional satisfaction scores.
Applying CES
CES can be applied to specific interactions.
- Placing an online order
- Contacting support
- Processing a return
It can also assess the overall service experience across multiple touchpoints. Adding follow-up questions about specific effort drivers provides granular insights into the root causes of customer frustration.
Benefits of Using CES
The benefits of using CES are numerous.
- Strong predictor of customer loyalty and repeat purchases. It offers a more focused approach than trying to achieve “delight.”
- Pinpoints friction in service processes. Organizations can prioritize improvements with the highest impact on the customer experience.
- Translates to higher customer retention, reduced operational costs, and increased revenue. You might find resources on optimizing support processes helpful: Our Supportman category sitemap.
Drawbacks of CES
Like any metric, CES has drawbacks.
- Fewer established benchmarks. As a newer metric, it lacks the extensive benchmarks of traditional metrics like customer satisfaction.
- May not capture emotional aspects. It might overlook nuances in customer sentiment.
- Doesn’t always reflect resolution quality. A customer might find it easy to get a refund, even if the initial product was faulty.
- Cultural differences affect perceptions of ‘ease’. Careful consideration is needed when applying CES across diverse customer bases.
Real-World Examples
Real-world examples demonstrate the power of minimizing customer effort. Amazon‘s 1-Click ordering system revolutionized online shopping by dramatically reducing the effort required to make a purchase. Similarly, USAA implemented CES to streamline claim processes, achieving a 15% reduction in repeat calls.
Implementing CES Effectively
To effectively implement CES, consider these tips:
- Timely Collection: Collect CES scores immediately after service interactions.
- Follow-Up Questions: Ask follow-up questions to identify specific sources of effort.
- Journey Mapping: Map customer journeys to pinpoint high-effort touchpoints.
- Segmentation: Segment CES data by channel, issue type, and customer segment.
- Prioritization: Focus improvements on common friction points affecting the most customers.
The concept of CES was popularized by Matthew Dixon, Karen Freeman, and Nicholas Toman in their 2010 Harvard Business Review article “Stop Trying to Delight Your Customers.” Their research, along with work by the Customer Contact Council and Gartner, has contributed to the widespread adoption of CES.
6. Customer Retention Rate (CRR)
Customer Retention Rate (CRR) is a vital key performance indicator (KPI) for customer service. It measures the percentage of customers a company keeps over a specific period. CRR offers direct insight into how well your service creates loyal customers and prevents them from leaving. A high CRR usually signals strong customer relationships, effective service, and a healthy business. This is why it’s a crucial customer service KPI.
How Is CRR Calculated?
CRR uses this formula:
((E-N)/S) × 100
Where:
- E = Number of customers at the end of the period
- N = Number of new customers acquired during the period
- S = Number of customers at the start of the period
Features and Benefits
CRR is typically measured monthly, quarterly, or annually. Tracking it regularly helps identify trends and address potential problems proactively. Segmenting CRR by customer type, value, or acquisition source offers even more detailed insights. This allows businesses to customize service strategies for different customer segments. Most importantly, CRR directly relates to customer lifetime value, a key metric for long-term profits.
Pros
- Directly Tied to Revenue and Profitability: Getting new customers is much more expensive (5-25x) than keeping current ones. A high CRR directly improves profits.
- Indicates Long-Term Service Quality and Relationship Strength: Consistently high retention shows your service team is building strong, lasting customer relationships.
- Helps Forecast Business Stability and Growth: Predictable recurring revenue from retained customers allows for better financial planning.
- Can Be Used to Evaluate Service Improvements Over Time: Tracking CRR after implementing new service initiatives helps measure their impact.
Cons
- Affected by Factors Beyond Customer Service: Pricing changes, competitor actions, and product quality can influence CRR, regardless of customer service quality.
- Doesn’t Show Why Customers Stay or Leave: While CRR shows retention levels, it doesn’t explain customer behavior.
- May Mask Problems if Only Measured at an Aggregate Level: Segmenting CRR is crucial to avoid overlooking issues affecting specific customer groups.
- Retention Doesn’t Always Equal Customer Satisfaction or Engagement: Customers may stay out of habit or lack of options, even if they aren’t satisfied.
Real-World Examples
- Slack, the workplace communication platform, maintains a high 98% retention rate by prioritizing user experience and providing responsive support.
- American Express improved retention by 10% after implementing service recovery programs for dissatisfied customers.
Practical Tips for Implementation
- Segment Retention Rates by Customer Value: Focus on retaining high-value customers who contribute the most revenue.
- Analyze Patterns of Departing Customers: Identify common reasons for churn to pinpoint service improvement areas.
- Implement Early Warning Systems: Use data to identify at-risk customers and address their concerns proactively.
- Create Dedicated Retention Teams: Specialized teams can handle the needs of customers considering leaving.
- Conduct Exit Interviews or Surveys: Gather direct feedback from departing customers to understand why they leave.
The Rise of CRR
The customer success movement, pioneered by software-as-a-service (SaaS) companies, has popularized CRR. Frederick Reichheld’s research on the “Loyalty Effect” solidified the link between customer retention and profitability, encouraging businesses to focus on this metric.
By carefully monitoring and improving your CRR, you can strengthen customer relationships, increase profits, and build a more sustainable business.
7. Service Level Agreement (SLA) Compliance

Service Level Agreements (SLAs) are the backbone of any customer-centric organization. They define the standards for response and resolution times, setting clear expectations for both the customer and the service team. Think of it like a promise: respond to emails within 4 hours or resolve technical issues within 24 hours. Tracking SLA compliance helps quantify how well these promises are being kept.
SLA compliance is a key performance indicator (KPI) because it provides a quantifiable measure of customer service effectiveness. Are your customers getting the timely service they expect? SLAs offer a concrete answer. More than just speed, well-defined SLAs foster a culture of accountability and drive continuous improvement within customer service teams.
Features of SLA Compliance Tracking
Here’s a breakdown of the key features:
- Percentage-Based Measurement: SLA compliance is typically expressed as the percentage of interactions that meet the pre-defined time standards. This gives a clear overview of overall performance.
- Tiered Structures: SLAs can be tiered based on customer segments (e.g., premium vs. standard) or the priority level of the issue (e.g., critical vs. low). This allows for flexibility in response times based on the importance of the customer or the urgency of the issue.
- Distinct Metrics: SLAs often differentiate between first response time (acknowledging a customer’s request) and resolution time (completely resolving the issue). Both are vital for a positive customer experience.
- Escalation Protocols: Effective SLA tracking includes escalation protocols for at-risk SLAs. This ensures timely intervention to prevent breaches and maintain service levels.
Pros and Cons of Monitoring SLA Compliance
Like any metric, focusing solely on SLA compliance has its advantages and disadvantages.
Pros:
- Accountability & Expectations: Sets clear performance expectations and promotes accountability within the team.
- Consistent Service: Provides a framework for consistent service delivery across different teams and communication channels.
- Identify Bottlenecks: Helps identify resource gaps, process bottlenecks, and areas for improvement in service delivery workflows.
- Aligned with Customer Expectations: Ensures that service delivery aligns with the expectations set with customers.
- Resource Planning: Provides data-driven insights for accurate staffing and resource allocation.
Cons:
- Perverse Incentives: Poorly designed SLAs can incentivize undesirable behavior, such as closing tickets prematurely without resolving the underlying issue.
- Focus on Speed, Not Quality: Overemphasis on speed can sometimes compromise the quality of the resolution.
- Lack of Flexibility: Rigid, one-size-fits-all SLAs might not cater to the diverse needs of different customer segments.
- Tracking System Requirements: Effective SLA monitoring requires robust tracking systems for accurate data collection and reporting.
Real-World Examples and Implementation Tips
Companies like Salesforce and Atlassian demonstrate the effective use of SLAs. Salesforce, with its reported 93% SLA compliance rate on Premier Support tickets, exemplifies a commitment to timely service. Atlassian’s tiered SLA structure showcases how to address varying customer needs.
For effective SLA implementation, consider these tips:
- Realistic Targets: Set attainable targets based on historical data, industry benchmarks, and customer expectations.
- Tiered Approach: Implement tiered SLAs based on customer segments and issue priority.
- Real-Time Monitoring: Use real-time dashboards to track progress and proactively address potential SLA breaches.
- Regular Review: Regularly review and adjust SLAs based on performance, feedback, and changing business needs.
- Balance Speed and Quality: Don’t sacrifice quality for speed. Balance speed metrics with quality indicators like customer satisfaction scores.
Evolution and Popularization
The concepts of SLAs and their importance gained significant traction with the rise of frameworks like ITIL (Information Technology Infrastructure Library) and ITSM (Information Technology Service Management). These frameworks provided a structured approach to service delivery. The emergence of platforms like ServiceNow and Zendesk further streamlined SLA implementation and tracking. Today, SLAs are a fundamental element of customer service operations in many organizations.
8. Customer Lifetime Value (CLV) to Customer Acquisition Cost (CAC) Ratio
The Customer Lifetime Value (CLV) to Customer Acquisition Cost (CAC) ratio is a key performance indicator (KPI) for gauging the long-term financial health of your customer service efforts. It essentially weighs the total revenue a customer generates throughout their relationship with your business (CLV) against the cost of acquiring them (CAC). This provides invaluable insights into the effectiveness of your customer acquisition and retention strategies.
This metric highlights the often-overlooked connection between customer service and financial performance. Instead of solely focusing on immediate satisfaction, it emphasizes the enduring financial benefits of positive customer experiences.
Features and Benefits
- Combines Financial Metrics with Customer Experience Outcomes: The CLV:CAC ratio directly correlates the quality of customer service with tangible financial results.
- Measures Long-Term Impact: By evaluating the long-term return on investment in acquiring and serving customers, this ratio assesses your business’s sustainability.
- Segment-Level Analysis: Calculating the ratio at the customer segment level allows you to pinpoint high-value customer groups and refine your service strategies accordingly.
- Benchmarking: A healthy ratio is typically considered 3:1 or higher, indicating that the CLV should be at least three times the CAC. This serves as a benchmark for evaluating your performance.
Pros
- Financial Justification for Service Investments: The CLV:CAC ratio offers concrete data to support investing in customer service improvements.
- Connects Service to Profitability: It directly links service quality to your bottom line.
- Balances Acquisition and Retention Spending: This metric helps optimize resource allocation between acquiring new customers and nurturing existing ones.
- Encourages Long-Term Thinking: It promotes a strategic focus on cultivating enduring customer relationships.
- Aligns Departments: The CLV:CAC ratio fosters alignment between service, marketing, and sales teams.
Cons
- Complex Calculation: Accurately calculating CLV can be complex and requires comprehensive data.
- Data Integration: It necessitates data from various systems, including CRM, financial, and service platforms.
- Long Feedback Cycle: The effects of service changes on CLV can take time to manifest.
- Oversimplification: The ratio may not fully capture the intricacies of complex customer interactions.
Real-World Examples
- Chewy.com: Known for its exceptional customer service, Chewy reportedly maintains a CLV:CAC ratio exceeding 4:1, validating their substantial investment in customer support. This showcases the power of excellent service in fostering customer loyalty and driving profits.
- Starbucks: By prioritizing their mobile app experience and personalized service, Starbucks has reportedly achieved a CLV:CAC ratio of 5:1, demonstrating the value of strategically enhancing the customer journey.
Tips for Implementation
- Customer Segmentation: Segment your customer base according to their value and customize service levels accordingly. High-value segments may warrant premium support.
- Track Service Impact: Closely monitor how service improvements influence average customer lifespan and purchasing behavior.
- Financial Modeling: Develop financial models to project the effects of service investments on CLV.
- Predictive Analytics: Leverage data analysis to identify which service improvements are most likely to enhance retention.
- Referral Value: Incorporate the value of customer referrals into your CLV calculations.
Evolution and Popularization
The CLV:CAC ratio gained prominence with the rise of SaaS and subscription-based business models, where recurring revenue and customer retention are paramount. Customer success methodologies have further underscored the importance of this metric. The seminal work of Don Peppers and Martha Rogers on one-to-one marketing also contributed to its wider adoption by emphasizing the significance of long-term customer relationships.
By diligently monitoring and analyzing the CLV:CAC ratio, businesses can make informed decisions regarding customer service investments, optimize resource allocation, and ultimately achieve sustainable growth and profitability.
8-Point Customer Service KPI Comparison
| Metric | Implementation Complexity (🔄) | Resource Requirements (⚡) | Expected Outcomes (📊) | Ideal Use Cases (💡) | Key Advantages (⭐) |
|---|---|---|---|---|---|
| First Contact Resolution (FCR) | Moderate – requires integration across channels and clear criteria for “resolved” | Moderate – advanced CRM and agent training investments | Improved satisfaction through fewer repeat contacts | Transactional support interactions needing immediate resolution | Enhances loyalty and identifies training gaps |
| Customer Satisfaction Score (CSAT) | Low – simple, post-interaction surveys | Low to moderate – basic survey tools and minimal analytics | Direct feedback highlighting strengths and weaknesses | Short service interactions or immediate feedback scenarios | Easy implementation and high customer understanding |
| Net Promoter Score (NPS) | Low – uses a single-question survey method | Minimal – periodic surveys and basic data analysis suffice | Reveals overall loyalty and potential for word-of-mouth growth | Overall brand perception and long-term loyalty tracking | Benchmarkable across industries with strategic value |
| Average Handle Time (AHT) | Low to moderate – dependent on integrated call/interaction tracking | Moderate – requires time tracking systems and call data analysis | Identifies efficiency opportunities and process bottlenecks | High-volume contact centers seeking staffing and efficiency insights | Highlights operational improvements and training needs |
| Customer Effort Score (CES) | Moderate – emerging metric needing tailored survey design | Low to moderate – standard survey tools, with possible journey mapping | Pinpoints friction points and operational challenges | Interactions where reducing customer effort is critical | Provides actionable insights to streamline customer experiences |
| Customer Retention Rate (CRR) | Low – simple calculation if customer data is accurate | Moderate – requires CRM integration and reliable customer records | Measures long-term loyalty and revenue stability | Subscription-based or loyalty-driven business models | Directly linked to profitability and sustainable growth |
| SLA Compliance | Moderate to high – demands real-time tracking systems and defined time metrics | High – relies on advanced monitoring tools and reporting mechanisms | Ensures consistent performance and accountability in service delivery | Environments with strict service time standards and multi-tier support | Drives operational consistency and effective resource planning |
| CLV:CAC Ratio | High – complex integration of financial and CRM data with predictive analytics | High – robust financial modeling and cross-functional data systems required | Aligns service quality improvements with profitability and ROI | Businesses aiming for sustainable growth and strategic service investments | Financially justifies customer service investments with long-term strategic alignment |
Level Up Your Customer Service
Mastering customer service requires a deep understanding of Key Performance Indicators (KPIs) and their impact on your business. Tracking these KPIs offers a complete view of the customer journey, from initial contact to long-term engagement. Metrics like First Contact Resolution (FCR), Customer Satisfaction Score (CSAT), Customer Effort Score (CES), and the CLV:CAC ratio provide valuable insights.
By analyzing these metrics, businesses can identify strengths, pinpoint weaknesses, and discover opportunities to improve their support strategies. This means actively working to improve FCR by empowering agents with the right tools and knowledge. It also involves addressing the root causes of negative CSAT scores and streamlining processes to reduce customer effort.
Using KPIs Effectively
Effective use of KPIs isn’t a one-time project. It requires a commitment to continuous learning and adaptation. Regularly review your chosen KPIs, analyze trends, and adjust your strategies accordingly.
- Regular Review: Consistent evaluation of KPIs ensures your strategies remain aligned with customer needs.
- Trend Analysis: Identify emerging patterns and anticipate future customer behavior.
- Strategic Adjustments: Adapt your approach based on data-driven insights.
The customer service field is always changing, with trends like AI-powered support and personalized experiences gaining traction. Staying informed about these developments and incorporating them into your long-term planning is essential for remaining competitive. Looking ahead to 2025 and beyond, adaptability is key.
Key Takeaways
- Data-Driven Decisions: KPIs empower you to make informed decisions about your customer service strategies.
- Continuous Improvement: Regularly reviewing KPIs allows for ongoing optimization and adaptation to evolving customer needs.
- Proactive Approach: Tracking KPIs enables you to identify potential issues before they escalate and negatively affect customer satisfaction.
- Enhanced Customer Experience: Focusing on improving key metrics directly contributes to a better overall customer experience.
- Increased Profitability: Improved customer satisfaction and retention have a direct, positive impact on your bottom line.
Want to empower your support team, streamline operations, and boost customer satisfaction? SupportMan integrates Intercom ratings directly into Slack, providing real-time feedback, fostering team collaboration, and delivering time-saving weekly reports. Stop wasting time switching between dashboards and start leveraging the power of real-time insights. Try SupportMan for free today and see the difference! https://supportman.io