Decoding The Net Promoter Score Equation
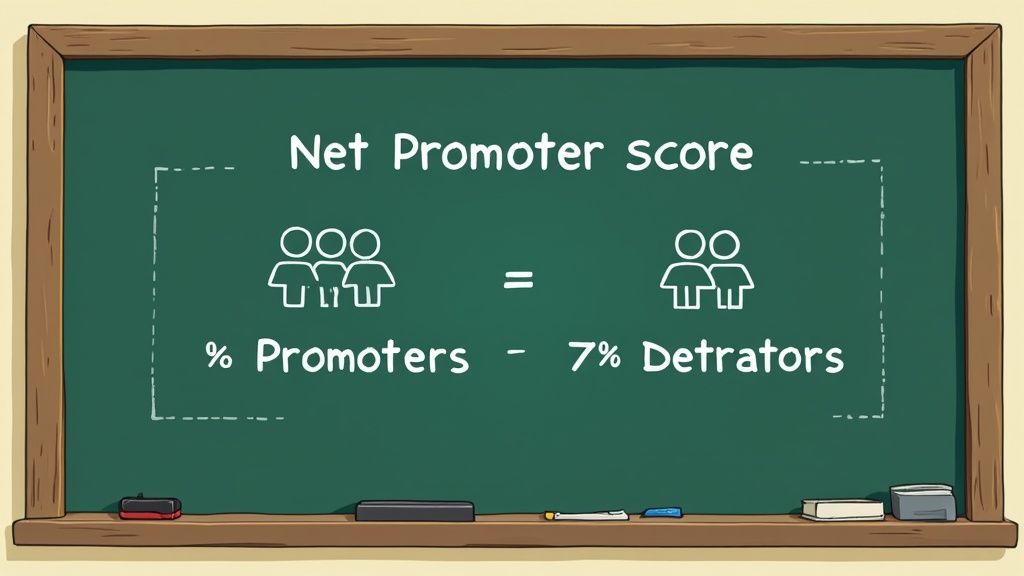
The Net Promoter Score (NPS) has become essential for understanding customer experience. But what's the math behind it? The NPS equation is surprisingly simple: NPS = % of Promoters – % of Detractors. This straightforward formula offers valuable insights into customer loyalty and growth potential.
Understanding the Components of the Equation
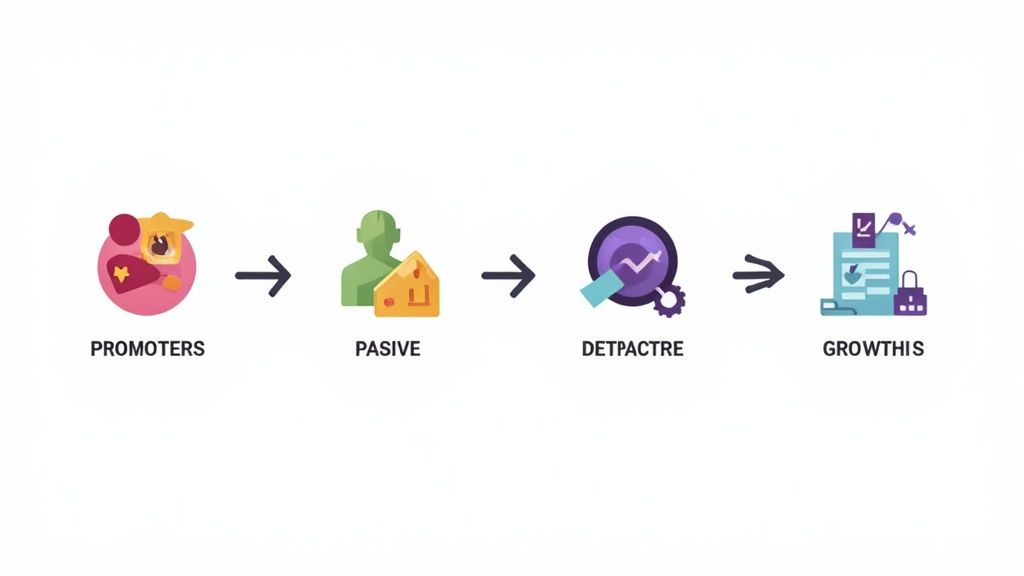
To understand the NPS equation, let's define its parts. The equation relies on three customer groups:
- Promoters (9-10): These enthusiastic customers are your brand ambassadors, fueling growth through positive word-of-mouth.
- Passives (7-8): Satisfied but not fully loyal, these customers represent a chance to boost satisfaction and create more Promoters.
- Detractors (0-6): Unhappy customers who may leave and potentially harm your brand through negative feedback.
The NPS equation focuses on the extremes—Promoters and Detractors—to illustrate your customer loyalty. This focus highlights both your strengths and areas needing improvement. While Passives are important for a complete customer experience view, they aren't directly used in the NPS calculation. This emphasizes the need to convert Detractors into Passives, and Passives into Promoters.
Calculating Your Net Promoter Score
Let's use an example. Imagine surveying 100 customers:
- 60 Promoters: 60% would likely recommend your business.
- 25 Passives: 25% are satisfied but not enthusiastic.
- 15 Detractors: 15% are unhappy and unlikely to recommend you.
Your NPS is 60% – 15% = 45. The NPS ranges from -100 (all Detractors) to +100 (all Promoters). A positive NPS is generally good, while a score above 50 is excellent. The NPS is a widely used metric for gauging customer loyalty and satisfaction. It was introduced by Fred Reichheld in his 2003 Harvard Business Review article "One Number You Need to Grow". Learn more about Net Promoter Score here.
Why the Net Promoter Score Equation Matters
The NPS equation's simplicity hides its significance. By focusing on the difference between Promoters and Detractors, the NPS clearly indicates customer loyalty and its impact on growth. This easy-to-understand metric helps businesses track progress, pinpoint areas for improvement, and build stronger customer relationships. This can boost customer lifetime value, decrease churn, and drive sustainable growth. Tools like Supportman can help integrate feedback collection and analysis into your workflow, making it easier to use the NPS for constant improvement.
Connecting Your NPS Score To Business Performance

Calculating your Net Promoter Score (NPS) is the first step. Understanding what it truly means for your business is where the real value lies. By connecting your NPS to tangible business outcomes, you can justify investments in customer experience and demonstrate the importance of a customer-centric strategy.
Translating NPS into Revenue Growth
A higher NPS often leads to increased revenue. Promoters, those who give you high scores, are your biggest advocates. They're more likely to recommend your business, fueling organic growth through word-of-mouth referrals. Promoters also tend to buy more, return often, and stay loyal to your brand.
A strong NPS can also reduce your customer acquisition cost (CAC). When satisfied customers become enthusiastic referrers, they effectively provide free marketing. This reduces your dependence on costly advertising and allows you to reinvest resources into customer retention and experience enhancements.
The Value Differential Between Promoters and Detractors
Understanding the financial difference between Promoters and Detractors is vital. Promoters drive revenue growth, while Detractors can negatively impact your business with bad reviews and lost customers. It’s important to not only acquire new customers, but also to actively transform Detractors into Passives, and ultimately, into Promoters.
A key statistic highlights the correlation between NPS and business growth: companies with high NPS typically grow at more than double the rate of their competitors. Companies with double the average NPS are more likely to achieve long-term, sustainable profits. Find more detailed statistics here. This emphasizes the importance of both cultivating Promoters and mitigating Detractor influence. Furthermore, Promoters are the source of over 80% of referrals, highlighting their crucial role in expanding your customer base.
To illustrate this further, let's look at the typical impact of different NPS ranges:
The following table shows the correlation between NPS and key business metrics.
NPS Score Impact on Business Performance
This table illustrates how different NPS score ranges typically correlate with business growth metrics and customer behaviors
| NPS Score Range | Typical Growth Rate | Customer Retention | Referral Generation |
|---|---|---|---|
| 70+ | High | Very High | Strong |
| 50-69 | Moderate | Moderate | Moderate |
| 30-49 | Low | Low | Weak |
| Below 30 | Negative or Stagnant | Very Low | Very Weak |
As you can see, a higher NPS score generally corresponds to better business performance across various key metrics.
Quantifying the ROI of Your NPS Program
Demonstrating the return on investment (ROI) of your NPS program is crucial for stakeholder support. One method is to calculate the lifetime value of a Promoter versus a Detractor. This data provides concrete evidence of the financial benefits of enhanced customer loyalty. Another approach is to track changes in revenue or customer churn after implementing improvements based on NPS feedback.
Tools like Supportman can streamline this process. They integrate customer feedback directly into your workflow, simplifying the collection, analysis, and action steps around NPS data. This enables quick responses to negative feedback, identifies areas for improvement, and cultivates a culture of continuous improvement.
Realistic Timeline Expectations
While customer experience improvements can quickly affect NPS, noticeable financial results take time. Building a solid customer base and a strong brand reputation is a long-term endeavor. Setting realistic timelines and focusing on consistent progress is key. This involves establishing clear benchmarks and diligently tracking performance over time.
By consistently measuring and analyzing your NPS, you can identify trends, gauge the effectiveness of your initiatives, and continuously refine your customer experience strategy. This ongoing process of improvement is crucial for sustained business growth and success.
The Evolution of the Net Promoter Score Equation

The Net Promoter Score equation, while simple, has a fascinating history. It continues to evolve alongside the ever-changing business world. From its beginnings as a novel metric, the NPS has become a staple for gauging customer loyalty. This ongoing development highlights its continued importance in understanding customer relationships.
The Genesis of the NPS
The Net Promoter Score equation sprang from extensive research spearheaded by Fred Reichheld. His team investigated various customer loyalty metrics across numerous industries. They eventually determined that the question, "How likely are you to recommend us to a friend or colleague?" was the strongest indicator of customer behavior. This question became the foundation of the NPS.
The NPS equation has significantly influenced how businesses approach customer experience. Reichheld’s team sent out 20 different questionnaires to thousands of customers across six industries. They discovered that the “likelihood to recommend” question best predicted customer loyalty and growth potential.
This simplicity and predictive ability positioned NPS as a crucial component of customer relationship management (CRM). By 2020, two-thirds of Fortune 1000 companies were using some form of NPS. Learn more about Net Promoter Score at Operative Intelligence.
Adapting to a Changing Landscape
Businesses have refined how they utilize the Net Promoter Score equation over time. Top organizations realized that merely calculating the score was insufficient. They began exploring the reasoning behind the scores.
This led to incorporating open-ended follow-up questions within NPS surveys. These questions allow businesses to collect valuable qualitative data. This feedback provides context and actionable insights, helping organizations understand customer sentiment.
Technology's Impact
Technology has significantly influenced the evolution of the Net Promoter Score. Tools like Supportman streamline feedback collection and analysis. They also integrate with communication platforms like Slack. This allows for real-time feedback processing and faster responses to customer concerns. This rapid action is critical for turning detractors into passives, and passives into promoters.
From Metric to Program
The evolution of NPS goes beyond just the equation. Many businesses have transitioned from simply tracking the score to creating full-fledged Net Promoter Programs. These programs use closed-loop feedback systems. Customer feedback directly influences operational changes and enhancements.
This shift signifies a deeper commitment to customer-centricity. It also acknowledges the strategic importance of customer feedback. These programs create a continuous improvement cycle, demonstrating how NPS has evolved from a basic metric to a dynamic business growth tool.
Beyond The Limitations Of The NPS Equation
While the Net Promoter Score (NPS) equation offers a valuable starting point for understanding customer loyalty, it's essential to recognize its limitations. Depending solely on this single metric can provide an incomplete picture of the customer experience. This section explores the potential drawbacks of the NPS equation and offers strategies to overcome them.
The Problem With Oversimplification
The simplicity of the NPS equation, while useful for quick comprehension, can sometimes obscure important details. A score of "7" could mean different things from different customers. One customer might feel genuine satisfaction, while another might be indifferent. Cultural factors also play a role in how customers respond to the "likelihood to recommend" question.
This means that relying solely on the numerical score can misrepresent true customer sentiment. A deeper dive into the reasoning behind the score is needed for a truly accurate picture.
Context Is Key: Going Beyond the Numbers
Successful organizations move beyond the NPS equation and explore the why behind the scores. They incorporate open-ended follow-up questions in NPS surveys. Asking questions like, "What could we do to improve your experience?" provides invaluable qualitative data that adds context to the numbers.
This deeper understanding allows businesses to make more targeted improvements and create personalized customer responses. It moves beyond simple satisfaction and into building genuine customer relationships.
Complementing NPS With Additional Metrics
Supplementing the NPS equation with other customer experience metrics provides a more well-rounded perspective. Metrics like Customer Effort Score (CES), Customer Satisfaction (CSAT), and Churn Rate each offer unique insights.
For instance, CES measures how easily customers interact with your business. This can reveal friction points in the customer journey. A holistic approach, using multiple metrics, paints a more comprehensive picture of the overall customer experience.
Building a Robust Measurement Framework
The NPS calculation has faced criticism regarding its predictive capabilities. Some studies show a weak correlation between NPS and actual future growth. The categorization of customers into Promoters, Passives, and Detractors has also been debated. Learn more about these criticisms here.
However, proponents of NPS emphasize its simplicity and actionability. By understanding its limitations and combining it with other metrics and qualitative feedback, businesses can create a more robust framework for measuring and improving customer experience.
Utilizing Tools for Efficient Feedback Management
This framework should include tools that facilitate efficient collection, analysis, and action on customer feedback. Platforms like Supportman integrate with communication tools like Slack, enabling real-time feedback processing and quicker responses. Rapid responses are key to addressing customer concerns, improving satisfaction, and ultimately, driving business growth.
Setting Meaningful NPS Benchmarks That Drive Action
Calculating your Net Promoter Score (NPS) is just the first step. The real value lies in understanding how your score compares to others and how you can improve it. This means establishing meaningful benchmarks that drive action and provide a clear path forward.
Why Benchmarking Matters
Benchmarking your NPS helps you see where you stand compared to your competitors and the overall industry. It allows you to set realistic goals for improvement and identify areas where you excel or need to focus. This comparison provides valuable context, transforming your NPS from a simple number into a powerful strategic asset.
Establishing Your Baseline
Before setting improvement goals, you need a solid baseline. This starting point represents your current NPS and serves as a reference for measuring progress. Gathering enough data is crucial for ensuring your baseline is accurate and representative of your customer base. Surveying a diverse group of customers across various segments creates a more reliable baseline.
Understanding industry averages can be very informative. Average NPS scores generally fall between 31 and 50. Scores above 50 are considered excellent, while scores below 0 indicate potential problems. For example, a company with 60% promoters and 10% detractors has an NPS of 50. Learn more about calculating NPS here. Companies continually strive to raise their NPS through regular surveys and by addressing detractor concerns.
Segmenting Your Benchmarks
While your overall NPS gives you a valuable overview, segmenting your benchmarks reveals deeper insights. Consider these segments:
- Customer Type: Different customer groups have different expectations.
- Region: Cultural nuances can influence survey responses.
- Product Line: Some products naturally lead to higher satisfaction.
Breaking down your NPS into smaller segments helps you pinpoint areas for improvement and tailor strategies to each group's needs.
The Competitive Landscape
Researching your competitors' NPS scores helps reveal where you are ahead or behind. This information can inform your customer experience strategies and help you differentiate your brand. Tools like Supportman can help you manage customer feedback, enabling continuous improvement and comparisons over time.
Creating an Improvement Roadmap
A successful NPS program requires a clear roadmap for improvement based on customer feedback. This roadmap should outline specific actions to address customer pain points and enhance the overall experience.
For example, if feedback reveals long wait times for support, then reducing wait times and improving response efficiency become priorities. By connecting your NPS to concrete action items, you transform customer feedback into a driver for continuous improvement. Consistent measurement and analysis are key to tracking the effectiveness of your initiatives and refining your strategy.
To help you evaluate your NPS, consider the following industry benchmarks:
Industry-Specific NPS Benchmarks
This table compares average NPS scores across different industries to help you evaluate your performance against relevant standards.
| Industry | Average NPS | Top Quartile | Bottom Quartile |
|---|---|---|---|
| Software & Apps | 45 | 60 | 20 |
| Online Retail | 42 | 55 | 18 |
| Healthcare | 35 | 50 | 15 |
| Financial Services | 30 | 45 | 10 |
| Telecommunications | 25 | 40 | 5 |
As you can see, Software & Apps and Online Retail tend to have higher NPS scores, while industries like Telecommunications often face greater challenges. Understanding these benchmarks helps you set realistic expectations and target your efforts effectively.
Building A High-Impact NPS Program That Delivers
Turning your Net Promoter Score (NPS) into a powerful program takes more than just calculating a number. It requires a strategic approach, weaving NPS into the core of your customer experience. This section offers a practical guide to designing, launching, and optimizing an NPS program that delivers real business results.
Designing Your NPS Survey For Maximum Impact
A successful NPS program starts with a well-designed survey. This means looking beyond the standard "likelihood to recommend" question and adding elements that boost response rates and offer valuable insights.
- Keep it concise: Shorter surveys get higher completion rates.
- Target specific segments: Tailoring questions to different customer groups gives more relevant data.
- Include open-ended questions: Asking "Why did you give us this score?" adds valuable context.
- Test and iterate: Experiment with question formats and delivery to find what works for your audience.
For example, segment surveys by demographics, product usage, or purchase history. This helps pinpoint specific pain points and tailor improvement efforts.
Building A Closed-Loop Feedback System
Gathering feedback is only half the work. The real power of NPS comes from closing the loop and acting on the insights. Top organizations build systems that route customer feedback to the right teams for prompt action.
- Automated routing: Send feedback directly to the right department or individual based on survey responses.
- Service recovery: Empower teams to address negative feedback and fix customer issues quickly.
- Continuous improvement: Use feedback to spot trends and make changes that improve the overall customer experience.
This turns every piece of feedback, positive or negative, into a learning opportunity.
Creating Cross-Functional Ownership
NPS shouldn't belong solely to the customer experience team. Building a customer-centric culture requires company-wide buy-in.
- Share results transparently: Make NPS data visible to all departments, connecting it to business performance.
- Integrate NPS into performance goals: Align individual and team goals with NPS improvement targets.
- Provide training and resources: Give employees the skills and tools to respond effectively to customer feedback.
Sales teams, for instance, can use NPS data to identify at-risk accounts and prevent churn. Product teams can use feedback to shape product roadmaps and prioritize features that boost customer satisfaction.
Leveraging Technology to Scale Personalized Responses
Technology is key to scaling your NPS program and personalizing responses. Platforms like Supportman integrate NPS feedback into your current workflow, enabling real-time analysis and automated follow-up. This lets you respond promptly, address concerns efficiently, and build better customer relationships.
- Integrations: Connect with tools like Slack for instant feedback notifications and team collaboration.
- Automated reports: Track important metrics and identify trends without manual work.
- Personalized responses: Customize follow-up messages based on individual feedback.
Training Your Team for Effective Feedback Management
Responding to feedback requires skilled and empathetic team members. Invest in training that prepares your employees to handle both positive and negative feedback well.
- Active listening: Teach team members to understand the emotions behind customer feedback.
- Empathy and understanding: Encourage responses that acknowledge customer feelings and validate experiences.
- Solution-oriented approach: Empower employees to offer real solutions to customer issues.
By giving your team these skills, you turn customer interactions into chances to build trust and strengthen relationships.
Supportman can help achieve these goals. By integrating customer feedback directly into your workflow, it empowers your team to respond quickly and effectively, turning insights into action. Start your free trial of Supportman today. Learn more about Supportman.