Net Promoter Score (NPS) is built on a straightforward yet powerful foundation. At its core lies a single question that reveals deep customer insights: “On a scale of 0 to 10, how likely are you to recommend [company/product/service] to a friend or colleague?” Often called the “ultimate question,” this simple query cuts straight to what matters – how customers truly feel about your business. Let’s explore how this rating system translates into meaningful metrics.
Breaking Down the NPS Calculation Process
Calculating NPS follows three clear steps that any business can implement:
- Categorizing Responses: Customer ratings fall into three groups:
- Promoters (9-10): Your biggest fans who actively recommend you to others
- Passives (7-8): Satisfied customers who could be tempted by competitors
- Detractors (0-6): Unhappy customers who may share negative feedback
- Calculating Percentages: Convert each group into a percentage of total responses. For example, with 200 responses where 100 are Promoters, they represent 50% (100/200 * 100).
- Applying the NPS Formula: Subtract the percentage of Detractors from Promoters to get your NPS, which ranges from -100 to +100. For instance, with 50% Promoters and 20% Detractors, your NPS is 30 (50 – 20). While Passives provide useful insights, they don’t factor into the final score.
Illustrating the NPS Calculation
Here’s a real-world example using 500 survey responses:
- Promoters: 250 responses (50%)
- Passives: 150 responses (30%)
- Detractors: 100 responses (20%)
Using the formula: 50% (Promoters) – 20% (Detractors) = 30. This NPS of 30 offers a clear benchmark of customer loyalty.
Why This Simple Calculation Matters
The real value of NPS lies in its connection to business performance. Research shows companies with higher NPS scores often see better revenue growth and profitability than competitors. This means focusing on turning Detractors into Promoters can directly impact your bottom line. By tracking NPS over time, you can spot trends, identify problems early, and measure whether your customer experience improvements are working.
Mastering the Mathematics of NPS Calculation
The NPS calculation may seem straightforward at first glance, but proper understanding and implementation are crucial for getting meaningful results. While the basic formula is simple, common mistakes in calculation and interpretation can lead to flawed insights. Let’s explore how to accurately measure and analyze your NPS data to gain actionable insights for your business.
Why the -100 to +100 Scale?
The -100 to +100 range serves a specific purpose – it creates a consistent framework for measuring customer loyalty that works across different industries and company sizes. This standardized approach makes it possible to benchmark performance and track progress over time. At -100, every single customer is a Detractor, indicating severe dissatisfaction. A perfect score of +100 means all customers are Promoters, though this is rarely achieved in practice. Even small improvements matter – moving from 20 to 30 can signal significant gains in customer sentiment and potential revenue impact.
Avoiding Common Calculation Pitfalls
A frequent error is including Passive responses in the NPS formula. While Passives provide useful context about customer feelings, they should not factor into the final calculation. Consistency in survey methods is also essential – changing how you phrase questions or distribute surveys can create artificial fluctuations in your scores. To get reliable trend data, maintain the same methodology over time so you’re tracking real changes in customer sentiment.
Maintaining Statistical Significance
Your sample size directly affects how much you can trust your NPS results. Too few responses can produce unstable scores that don’t reflect your broader customer base. For example, getting glowing feedback from just a handful of customers could inflate your NPS unrealistically. On the flip side, a few negative responses in a small sample could tank your score unfairly. Focus on getting enough responses to ensure your results are statistically valid. This often requires developing robust survey distribution strategies to boost participation rates.
Real-World Examples: Adapting the Calculation
Many companies modify their NPS approach based on their specific needs. Some slice the data by product line, customer segment, or key touchpoints to pinpoint problem areas. Others factor in customer value when weighing responses, recognizing that feedback from big spenders may deserve extra consideration. However, any customization requires careful thought to avoid introducing bias. Understanding these nuanced applications of NPS helps paint a more complete picture of customer loyalty patterns.
Understanding the Three Customer Categories That Drive Growth

Now that we understand how NPS is calculated, let’s look at the three key customer groups that emerge from this measurement: Promoters, Passives, and Detractors. These categories reflect real patterns in customer behavior that directly affect business growth. By examining each group closely, companies can better understand their customers and make smarter decisions about serving them.
Decoding the Promoter Mindset
Promoters give ratings of 9 or 10 and are your biggest fans. These customers actively recommend your products and services to others, providing powerful word-of-mouth marketing that often brings in new customers more effectively than paid ads. For instance, a software company with many Promoters typically sees strong growth through positive online reviews and personal referrals. To create more Promoters, focus on going above and beyond in every customer interaction. When you consistently exceed expectations, you build the kind of loyalty that turns satisfied customers into active advocates.
Navigating the Passive Perspective
Passives, who give scores of 7 or 8, are satisfied but not enthusiastic. While these customers like your product or service, they could easily switch to competitors if given a reason. The good news is that Passives represent a clear opportunity for improvement. By listening to their feedback and addressing their specific concerns, you can help them become Promoters. For example, a retail store might use Passive feedback to make targeted improvements to their product selection or customer service approach. This focused effort to better serve Passives often leads to stronger customer relationships and reduced turnover.
Addressing the Detractor Dilemma
Detractors score between 0 and 6 and pose a serious risk to growth. These unhappy customers tend to leave and share negative experiences that can harm your reputation. While you may not win over every Detractor, taking quick action to address their concerns is essential. Reaching out personally to understand and fix their issues can help limit negative word-of-mouth and sometimes even turn them into supporters. Take the example of a phone company that directly contacts dissatisfied customers about service problems – this proactive approach often prevents bad reviews and rebuilds trust. The key is learning from Detractor feedback to stop similar issues from happening again. By reducing Detractors and growing your Promoter base over time, you create the foundation for sustainable growth through customer advocacy.
Transforming Raw Data Into Meaningful Insights
Understanding NPS goes far beyond just knowing how to calculate it. The real value comes from interpreting the scores and using those insights to guide business decisions. Let’s explore how different companies apply NPS in practice.
Real-World NPS Calculation Examples
Let’s look at some actual NPS calculations across different industries. Take a SaaS company that collected 500 customer responses:
- Promoters (9-10): 200 responses (40%)
- Passives (7-8): 150 responses (30%)
- Detractors (0-6): 150 responses (30%)
Using the NPS formula (Promoters% – Detractors%), we get: 40% – 30% = 10. This score gives the company a starting point to track improvements over time.
Now compare this to a luxury hotel chain with the same number of responses:
- Promoters (9-10): 350 responses (70%)
- Passives (7-8): 100 responses (20%)
- Detractors (0-6): 50 responses (10%)
Their NPS calculation shows: 70% – 10% = 60. This higher score reflects how personalized service in luxury hospitality often leads to stronger customer loyalty compared to other industries.
Benchmarking Your NPS: Industry and Size Comparisons
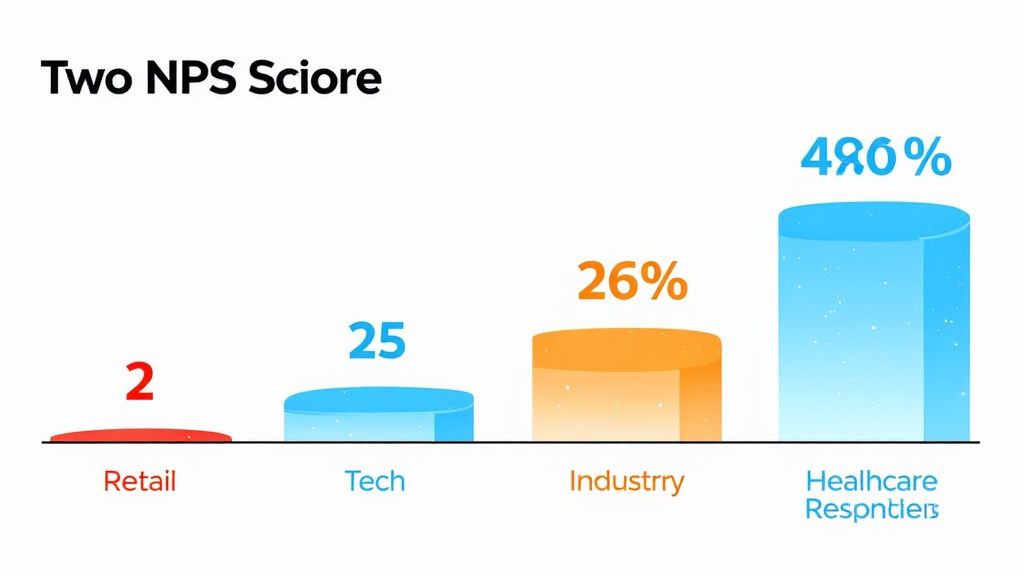
Looking at NPS in isolation only tells part of the story. For example, a software company’s score of 10 might seem low compared to the hotel chain’s 60. However, if the software industry average is 5, then 10 actually shows strong performance. This highlights why industry benchmarks matter for meaningful comparisons.
Company size also affects NPS patterns. Small businesses often achieve higher scores since they can provide more personal customer attention. The key is comparing your NPS against similar companies while tracking your own trends over time.
Case Studies: Deconstructing NPS Success
Looking at top performers provides valuable insights. For instance, Apple maintains outstanding NPS by focusing on user experience at every touchpoint – from product design to retail interactions. Similarly, The Ritz-Carlton sets hospitality standards by empowering staff to exceed guest expectations. Both examples show how consistently good experiences drive customer loyalty.
Adapting the Calculation to Your Needs
While the core NPS formula stays constant, companies often customize their analysis. Some segment data by product lines or customer demographics to pinpoint improvement areas. Others weight responses based on customer value to focus on key accounts.
Breaking down NPS this way helps identify which customer groups are most satisfied and which need attention. But any modifications should be made carefully to maintain data integrity. The goal is getting actionable insights while keeping the metric’s reliability.
By mastering both calculation and interpretation, companies can use NPS effectively to build customer loyalty and drive sustainable growth.
Advanced NPS Analysis and Segmentation Strategies

Getting your basic Net Promoter Score is just the starting point. The real value lies in digging deeper through detailed analysis and customer segmentation. By examining patterns and trends within different customer groups, you can uncover specific insights to improve experiences and results. Sometimes a decent overall NPS can mask serious issues affecting certain customer segments.
Segmentation: Uncovering Hidden Trends
Breaking down your customer base into smaller groups based on shared traits helps identify what’s really driving your NPS scores up or down. You might group customers by demographics, purchase patterns, product usage, or survey responses. This targeted approach lets you spot problems affecting specific segments rather than making broad assumptions. For example, you may find that customers who’ve been with you for years have much lower satisfaction than new customers – pointing to potential issues with long-term support or product development.
Looking at NPS within segments also provides context for overall score changes. A dip in your total NPS might actually stem from problems with just one customer group rather than widespread dissatisfaction. With this detailed view, you can focus your improvement efforts and resources where they’ll have the most impact.
Tracking NPS Evolution: Identifying Turning Points
Regular monitoring of your NPS trends, whether monthly, quarterly or annually, is key for measuring how your customer experience initiatives are performing. Sharp drops in scores often signal immediate problems needing attention, like product issues or poor service interactions. On the flip side, steady NPS increases show your customer-focused efforts are paying off.
This ongoing tracking also helps set realistic targets. By understanding your historical NPS performance, you can establish meaningful goals for improvement. For instance, if your score typically hovers around 30, aiming to increase it by 5 points next quarter makes more sense than shooting for an unrealistic jump to 70.
Predictive Analysis: Proactive Problem Solving
Taking NPS analysis further with advanced analytics lets you spot potential issues before they impact customers. By combining NPS data with other customer information like demographics and purchase history, you can build models to forecast satisfaction trends. This helps you get ahead of problems rather than just reacting to them after the fact. You’ll also gain clarity on which factors most strongly influence customer loyalty, allowing you to prioritize improvements that will best support your long-term success and growth.
Implementing Action-Driven NPS Programs

Understanding how NPS works is just the beginning. To get real value, you need to turn your Net Promoter Score program into an engine for growth and improvement. This means creating feedback loops that drive meaningful changes across your organization. Let’s explore how to make your NPS program truly effective.
Closing the Feedback Loop: From Insight to Action
NPS data only matters if you act on it. This means taking concrete steps based on both positive and negative feedback. When you reach out to Detractors to understand their concerns and find solutions, you can often turn a negative experience into a positive one. Not only does this help prevent negative word-of-mouth, but it shows customers you truly care about their satisfaction. Similarly, following up with Promoters to thank them reinforces their loyalty and keeps them engaged with your brand.
Strategies for Reducing Detractor Rates
To improve your overall NPS, you need to focus on reducing your percentage of Detractors. This starts with finding the root causes of customer dissatisfaction. Are customers unhappy with product quality? Having bad service experiences? Something else entirely? Understanding exactly why customers give low scores is key. For example, if you notice many customers complain about long support wait times, you can focus on reducing those delays. This targeted approach, based on real feedback, works better than making random improvements.
Converting Passives Into Promoters: The Untapped Potential
Your Passive customers represent a big opportunity. While they’re satisfied, they aren’t yet enthusiastic brand advocates. The key is understanding what would make them more excited about your company. Sometimes simple gestures like sending personalized emails about their past purchases or offering special deals can make the difference. In other cases, proactively addressing their potential concerns shows you’re committed to their success. The main thing is taking a personal approach focused on exceeding their expectations.
Maintaining Momentum: Continuous Improvement
Improving NPS isn’t a one-time project – it requires ongoing effort and attention. You need to consistently monitor scores, analyze what customers are saying, and make changes based on that input. Think of it like tending a garden – it needs regular care to thrive. This means reviewing feedback trends each quarter to spot emerging issues early. By staying proactive, you can keep building on your progress rather than letting the customer experience stagnate.
Fostering a Culture of Customer-Centricity
Getting great NPS scores takes more than just having good customer service. Every team needs to understand how their work impacts customer satisfaction and feel accountable for improving it. When the whole organization prioritizes customer needs, you create a culture focused on delivering great experiences. Sharing NPS data and customer feedback across departments helps keep everyone aligned on what matters most to customers.
SupportMan makes it easy to put these strategies into practice. By connecting Intercom ratings directly to Slack, you can quickly address negative feedback, celebrate wins, and gather insights to keep improving your customer experience. Start your free trial today and see how SupportMan can help you build a more effective NPS program. Try SupportMan for Free


