What is Net Promoter Score (NPS)?

Net Promoter Score (NPS) is a widely used metric for understanding customer loyalty and its potential impact on business growth. It all comes down to one key question: "On a scale of 0 to 10, how likely are you to recommend [your company/product/service] to a friend or colleague?" This seemingly simple question offers valuable insights into customer sentiment. This article explores what NPS is and why it’s important for understanding how your customers feel about your business, leading to better decision-making.
Why is NPS Important?
NPS is more than just a number; it's a powerful tool for evaluating the health of your customer relationships. A high NPS is often associated with strong customer loyalty, leading to positive word-of-mouth referrals and, as a result, increased revenue. For instance, a company with a high NPS might experience more organic growth through recommendations than a company with a low NPS that relies heavily on paid advertisements. Furthermore, NPS can pinpoint areas for improvement within your business. A low score can indicate underlying problems with your product, service, or the customer experience as a whole. This allows you to proactively address these problems and build stronger customer relationships. Knowing how to calculate your NPS is the first step toward using this valuable metric effectively.
How NPS Works
The effectiveness of NPS comes from how it classifies customer responses. Customers are grouped into three categories based on their rating:
- Promoters (9-10): These are your enthusiastic and loyal customers, actively recommending your business and generating positive word-of-mouth. They are more likely to remain customers and potentially increase their spending.
- Passives (7-8): These customers are generally satisfied but not particularly loyal. They might be open to offers from competitors and are less likely to actively recommend your business. Think of them as neutral observers.
- Detractors (0-6): These are unhappy customers who might stop using your product or service and could potentially harm your brand reputation through negative word-of-mouth or reviews. Addressing their concerns is critical to minimizing potential damage.
Calculating your NPS requires a clear understanding of these categories. By understanding how your customers are distributed across these three groups, you gain a more accurate understanding of your customer base's overall sentiment, enabling you to adapt your strategies accordingly. This understanding sets the foundation for the next step: learning how to actually calculate your NPS.
The NPS Formula Explained

Now that we’ve discussed the importance of Net Promoter Score (NPS) and how it categorizes customer responses, let's delve into the specifics of calculating it. The formula itself is quite straightforward, involving a simple subtraction. However, accurately classifying responses and calculating percentages requires careful attention. This means that understanding each step is crucial for reliable results.
Step 1: Categorize Responses
The first step in calculating your NPS involves correctly classifying customer feedback. Remember, each response to the "likelihood to recommend" question belongs to one of three categories: Promoters (9-10), Passives (7-8), and Detractors (0-6). Imagine visually sorting these responses into three separate containers, each labeled accordingly. This categorization is the basis of the NPS calculation.
Step 2: Calculate Percentages
After categorizing the responses, the next step is determining the percentage of respondents in each category. Divide the number of respondents in each group by the total number of responses and then multiply by 100. As an example, if you surveyed 200 customers and 100 were Promoters, the percentage of Promoters would be (100/200)*100 = 50%. Similarly, if 40 respondents were Detractors, the percentage would be (40/200)*100 = 20%. Accuracy in these calculations is essential for arriving at the correct NPS.
Step 3: Apply the NPS Formula
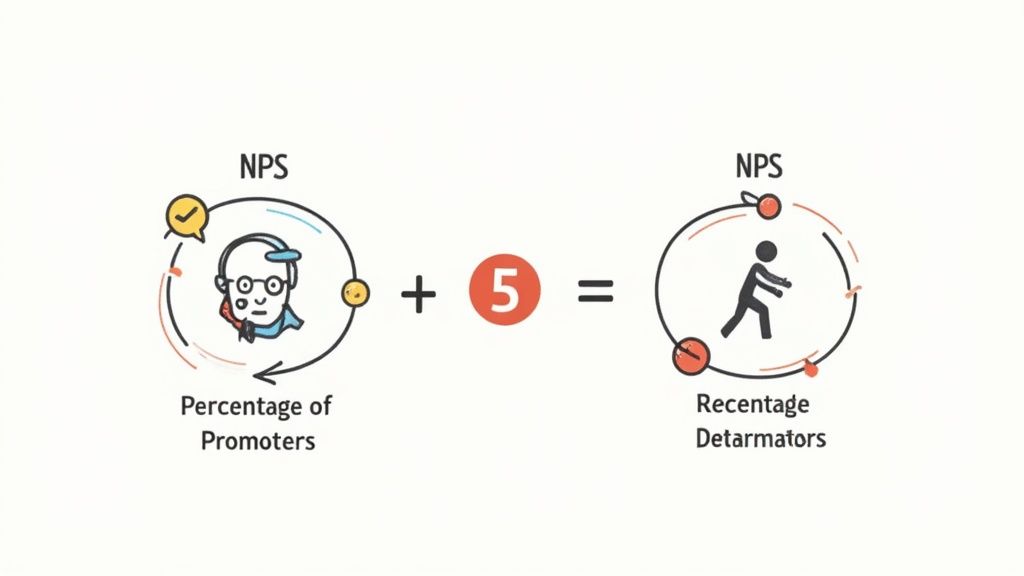
The final step is applying the NPS formula: NPS = % Promoters – % Detractors. This means you subtract the percentage of Detractors from the percentage of Promoters. Using the previous example, with 50% Promoters and 20% Detractors, your NPS would be 50% – 20% = 30. Note that Passives aren't directly used in the calculation, but their presence influences the overall percentages of Promoters and Detractors. This underscores the importance of collecting all responses for a truly representative NPS.
Example Calculation
Let's solidify these steps with another example. Imagine you distribute an NPS survey and receive 500 responses:
- Promoters (9-10): 250 responses
- Passives (7-8): 150 responses
- Detractors (0-6): 100 responses
First, calculate the percentages:
- % Promoters: (250/500) * 100 = 50%
- % Detractors: (100/500) * 100 = 20%
Then, apply the formula:
- NPS: 50% – 20% = 30
Your NPS in this scenario is 30. This gives you a quantifiable measure of customer loyalty and offers valuable insights into the state of your customer relationships. Accurately calculating your NPS is fundamental to using this metric to guide business decisions and improve the customer experience. This, in turn, prepares you to create effective NPS surveys and interpret your findings, which we’ll cover in the next sections.
NPS Survey Best Practices
Knowing how to calculate NPS is only part of the process. Gathering truly valuable insights depends on how effectively you design and implement your NPS survey. Consider these best practices to maximize response rates and ensure your data is accurate and actionable. Careful planning and execution are key ingredients for a successful NPS program.
Timing is Everything
The timing of your survey can significantly affect the responses you receive. Immediately after a positive interaction, such as a successful purchase or a helpful support experience, customers are more inclined to be Promoters. Conversely, surveying after a negative experience could skew your results toward Detractors. The key is finding a balance. Sending surveys at regular intervals, like quarterly or bi-annually, can help capture a broader view of customer sentiment. In addition, transactional surveys sent immediately after specific interactions can offer valuable real-time feedback.
Keep it Concise
No one enjoys lengthy surveys. Keeping your NPS survey brief is crucial. Focus on the core "likelihood to recommend" question and, if needed, a short follow-up question for additional feedback. For example, you could ask, "What could we do to improve your experience?" after the rating question. This focused approach encourages higher completion rates, allowing you to efficiently gather essential data without overwhelming your customers.
Target Your Audience
Just as timing is important, so is the audience you survey. Sending the same NPS survey to all customers, regardless of their engagement with your business, can result in skewed data. Consider segmenting your audience based on factors like purchase history, product usage, or demographic information. This targeted approach allows you to tailor the survey and glean more specific insights. For example, a long-term customer's feedback will offer different perspectives than a new customer's feedback. This targeted approach helps pinpoint areas for improvement within specific customer segments.
Follow Up and Close the Loop
Calculating your NPS is only the first step. What truly differentiates successful NPS programs is how they use the data. Following up with both Detractors and Promoters is essential. Reaching out to Detractors to understand their concerns and address any issues can transform negative experiences into positive ones. For Promoters, thanking them for their feedback and requesting testimonials or referrals can solidify their loyalty and amplify positive word-of-mouth. Actively engaging with your customers is crucial for maximizing the value of NPS. This closed-loop feedback system demonstrates that you value customer input and are dedicated to continuous improvement.
Interpreting NPS Results

Knowing how to calculate your NPS is essential, but understanding what the score means is equally critical. This means moving beyond the raw number and exploring the subtleties within your results. Interpreting your NPS score involves understanding its implications for your business and using it to inspire actionable improvements. This section will guide you through analyzing your NPS, comparing it to industry benchmarks, and using it as a driver for growth.
Understanding Your Score
An NPS score can range from -100 to +100. A score above 0 is generally positive, indicating you have more Promoters than Detractors. A score above 50 is considered excellent, suggesting a very loyal customer base. However, a negative score suggests that you have opportunities to improve customer satisfaction. This is not a failure; it’s a chance to learn and grow.
For instance, two companies could both have an NPS of 30. One company might have 60% Promoters and 30% Detractors, while the other might have 40% Promoters and 10% Detractors. While their NPS scores are identical, the underlying customer dynamics are distinct. The first company, despite having more Promoters, also has a higher percentage of Detractors, which signals potential issues. This highlights the importance of examining the distribution of Promoters, Passives, and Detractors, rather than focusing solely on the final NPS number.
Benchmarking Your NPS
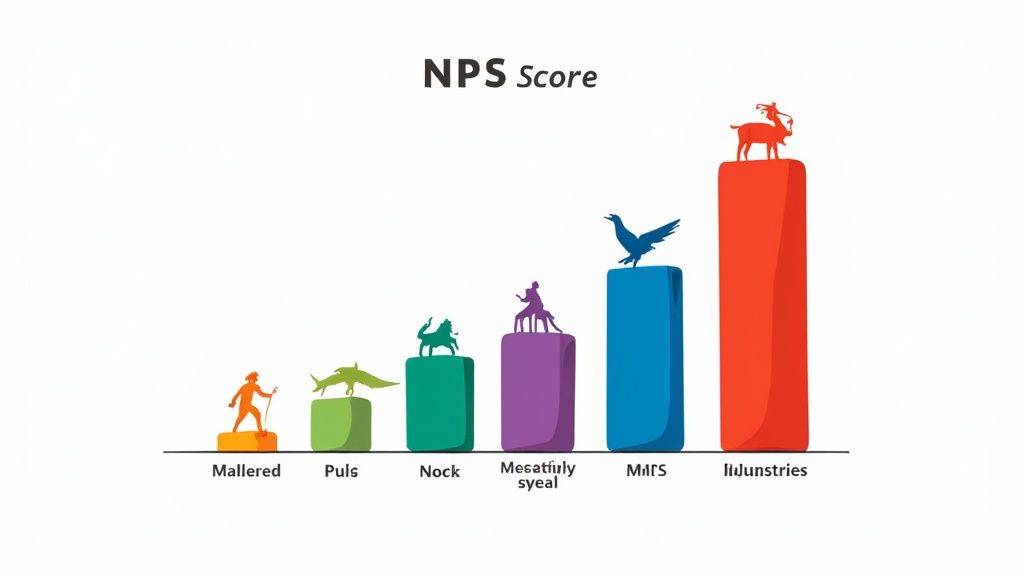
Comparing your NPS to industry benchmarks adds valuable perspective. This allows you to see how your score stacks up against competitors and identify areas of strength or weakness. It's important to remember, however, that benchmarks aren't fixed targets; they serve as points of reference. A software company might strive for an NPS of 30, while an airline might consider 10 a reasonable score. Moreover, NPS benchmarks can fluctuate based on region and other factors. Therefore, understanding the specific context of your industry and target market is essential for meaningful benchmarking.
Actionable Insights from NPS
Interpreting your NPS involves translating it into actionable insights. This means using your data to pinpoint areas for improvement and implement concrete changes. A low NPS might reveal problems with your product, service, or customer support, leading to initiatives like product redesigns, customer service training, or process improvements.
Analyzing the qualitative feedback from your NPS survey also provides valuable details. This feedback, often gathered through open-ended follow-up questions, can reveal the reasoning behind customer ratings. Pay close attention to the why behind the scores. A Detractor might explain their dissatisfaction with a specific product feature or a long wait time for customer support. This targeted feedback offers clear areas for improvement. Combining quantitative NPS data with qualitative feedback is the most effective approach to understanding customer sentiment and driving positive change within your business. Continuously monitoring and acting on your NPS results can lead to increased customer loyalty, more referrals, and ultimately, greater business growth.
Industry Benchmarks

After learning how to calculate your NPS, it's helpful to compare your score with others in your industry. Examining industry benchmarks gives you a sense of where you stand. These benchmarks offer valuable context, allowing you to determine if your NPS is above or below average and revealing potential areas for improvement. This comparison can be a powerful motivator and a valuable guide for refining customer experience strategies.
Why Industry Benchmarks Matter
Benchmarking your NPS against competitors gives you an external perspective. If your NPS is significantly lower than the industry average, it could point to underlying issues that need attention. Conversely, a higher-than-average NPS can highlight your strengths and offer opportunities to further capitalize on them. Benchmarking isn't just about comparing numbers; it's about extracting insights and identifying strategic actions.
Interpreting Benchmarks Carefully
While industry benchmarks provide useful information, they should be interpreted cautiously. Different industries tend to have different average NPS scores. Software companies, for instance, often have higher NPS scores than internet service providers. Therefore, comparing your score to a company in a completely different industry isn't particularly helpful. Even within the same industry, factors like company size and target market can influence NPS. A niche software company serving a small, specialized customer base might have a different NPS than a large software corporation catering to a wider audience. Finding relevant benchmarks within your specific niche is essential for accurate comparisons.
Finding Relevant Benchmarks
Several resources offer industry-specific NPS benchmarks. You can find data on average NPS scores for various sectors in online databases, industry reports, and publications from specialized consulting firms. This allows you to identify truly relevant benchmarks for your business. Remember that benchmarks are snapshots in time. Customer expectations and the competitive landscape are always shifting, so staying up-to-date on current trends and adjusting your strategies accordingly is crucial.
Examples of Industry Benchmarks
To illustrate how NPS can differ across industries, here are a few examples:
- Software: Often reports high NPS scores, sometimes exceeding 50, often due to a focus on innovation, customer support, and strong user communities.
- Retail: Typically shows a broader range of NPS scores, influenced by factors such as price, product quality, and customer service.
- Telecommunications: Generally has lower NPS scores, often due to challenges related to service reliability, customer support, and complex pricing.
These are just examples, and variations exist within each industry. A luxury retailer, for example, might have a higher NPS than a discount retailer. This underscores the importance of using benchmarks that are relevant to your company's size, target market, and specific competitive landscape. Utilizing these benchmarks effectively can help you understand your position within the industry and identify opportunities to elevate your customer experience and, ultimately, your NPS.
Improving Your NPS Score
Calculating your NPS is a critical first step, but the true benefit lies in using that knowledge to improve your score. A higher NPS typically leads to stronger customer loyalty, positive word-of-mouth referrals, and a healthier bottom line. Actively working to improve your NPS should be an ongoing effort. This section explores actionable strategies to enhance customer satisfaction and boost your score.
Focus on the Customer Experience
Improving your NPS starts with prioritizing the overall customer experience. This involves examining every point of contact a customer has with your business, from the initial interaction to ongoing support. Think of it as a journey. A smooth, enjoyable journey leads to happy customers, while a bumpy, frustrating one creates Detractors. Every interaction should be positive and contribute to a seamless overall experience.
Simplifying website navigation, providing clear product information, and offering prompt and helpful customer support can contribute to a positive experience. This goes beyond simply fixing problems; it's about anticipating customer needs and exceeding their expectations.
Empower Your Support Team
Your support team is at the forefront of customer interaction. Giving them the resources to effectively resolve customer issues is crucial for boosting your NPS. Equip them with the right tools, training, and the autonomy to solve problems efficiently. For example, allowing support agents to offer refunds or discounts without managerial approval can significantly improve customer satisfaction. Regular training on product knowledge, customer service techniques, and conflict resolution further prepares your team for various customer interactions. A well-trained and empowered support team is a key asset in improving your NPS.
Actively Solicit and Act on Feedback
Gathering customer feedback is critical for understanding their needs and uncovering areas for improvement. This means expanding beyond the NPS survey and actively seeking feedback through various channels, like email surveys, website feedback forms, and social media monitoring. Collecting feedback is important, but acting on it is what truly drives positive change. If customers consistently report issues with a particular product feature, addressing those concerns through product updates or redesigns demonstrates that you value their input and are committed to continuous improvement. This closed-loop feedback system, where customer input directly informs business decisions, fosters a more customer-centric approach and leads to a higher NPS.
Close the Loop with Detractors
Detractors represent a valuable opportunity for growth. While it might seem counterintuitive, reaching out to unhappy customers and addressing their concerns can convert them into Promoters. Engaging with Detractors is not just about damage control; it's about building stronger relationships. If a customer posts a negative review, contacting them to understand their experience and offer a solution can transform a negative interaction into a positive one. This demonstrates that you value their feedback and are genuinely interested in resolving their issues. This proactive approach not only improves your NPS but also strengthens customer loyalty.
Celebrate Your Promoters
Promoters are your greatest advocates. They're not only loyal customers, but they also act as brand ambassadors, spreading positive word-of-mouth referrals. Recognizing and appreciating your Promoters is vital for reinforcing their loyalty and encouraging their continued advocacy. Offering exclusive discounts, early access to new products, or even sending a personalized thank you note can make Promoters feel valued. Encouraging Promoters to share their positive experiences through testimonials or online reviews can further amplify their influence and attract new customers. This creates a positive feedback loop, where satisfied customers attract more satisfied customers, resulting in a consistently high NPS.
Streamline your customer feedback process and boost your NPS with SupportMan. Get real-time insights from Intercom ratings directly in Slack, empowering your team to respond quickly and effectively to customer feedback. Start your free trial today – no credit card required! SupportMan


