Key Takeaways
- NPS is a single-question survey that measures advocacy potential - whether customers trust your product enough to recommend it to others
- The formula is simple: % Promoters minus % Detractors = NPS (range: -100 to +100)
- Scores above 0 are positive, above 50 are excellent, above 70 are world-class
- NPS tells you how many customers would recommend you - it doesn't tell you why; always pair it with a follow-up question
- Industry benchmarks vary widely - compare against your own sector, not a universal standard
- CSAT is the daily homework grade. NPS is the report card.
What is Net Promoter Score?
Net Promoter Score (NPS) is built on one question: "On a scale of 0 to 10, how likely are you to recommend [company/product/service] to a friend or colleague?"
A bit of background:
- Developed in 2003 by Frederick Reichheld with Bain & Company and Satmetrix
- Published in Harvard Business Review as a simpler alternative to multi-question satisfaction surveys
- The core argument: willingness to recommend predicts business growth better than any longer survey
- Now a standard benchmark across most industries
It's usually described as a measure of customer loyalty - and that's mostly right, but worth interrogating. Loyalty and willingness to recommend aren't quite the same thing. You can be genuinely loyal to a product and still not recommend it, simply because you know it doesn't suit the people around you. What NPS actually measures is closer to advocacy potential - whether a customer trusts the product enough to put their own reputation behind it. That's a high bar, and a useful one. But it's a proxy for loyalty, not loyalty itself.
The distinction matters because it shapes how you act on the data. A low NPS doesn't always mean customers are unhappy - sometimes it means your product is niche, or your customers aren't in environments where they'd naturally recommend it. Context is everything.
The Three Categories
| Category | Score | Who they are |
|---|---|---|
| Promoters | 9–10 | Active advocates - likely to recommend you, buy again, and forgive the occasional mistake |
| Passives | 7–8 | Satisfied but not enthusiastic - won't say anything bad, but vulnerable to a competitor making them a better offer |
| Detractors | 0–6 | Unhappy customers - some churn quietly, others share their experience publicly |
The 0–6 Detractor range is wider than it looks. A 6 is very different from a 2, but both count the same in the formula - something worth keeping in mind when you're interpreting your scores.
How to Calculate NPS
Step 1 - Run the survey
Ask the question to a representative sample of customers. The sample needs to be large enough to be statistically meaningful - a handful of responses will produce an unstable number that swings wildly. As a rough guide, aim for at least 100 responses before drawing conclusions.
Keep the methodology consistent. If you change how you ask the question, when you send it, or who you send it to, you lose the ability to track trends over time.
Step 2 - Categorise responses
Sort every response into one of the three categories:
- 9–10 → Promoter
- 7–8 → Passive
- 0–6 → Detractor
Step 3 - Calculate percentages
Divide the number in each group by total responses and multiply by 100.
Example: 500 survey responses - 250 Promoters, 150 Passives, 100 Detractors
- % Promoters: (250 ÷ 500) × 100 = 50%
- % Passives: (150 ÷ 500) × 100 = 30% (not used in formula)
- % Detractors: (100 ÷ 500) × 100 = 20%
Step 4 - Apply the formula
NPS = % Promoters − % Detractors
Using the example above: 50 − 20 = NPS of 30
The result is always a whole number between −100 and +100. There's no % symbol - NPS is a score, not a percentage.
What's a Good NPS Score?
This depends heavily on your industry. A score of 30 might be excellent in one sector and mediocre in another. Using a universal benchmark misses the point.
Industry benchmarks (approximate)
| Industry | Average NPS | Top performers |
|---|---|---|
| Technology / SaaS | 35–45 | 60+ |
| B2B services | 39–76 | 70+ |
| Financial services | 20–40 | 55+ |
| Healthcare | ~34 | 55+ |
| Retail / ecommerce | 30–50 | 70+ |
| Telecommunications | ~15 | 40+ |
Sources: Bain & Company, Retently benchmarks. These shift year on year - treat as directional.
The general rule of thumb
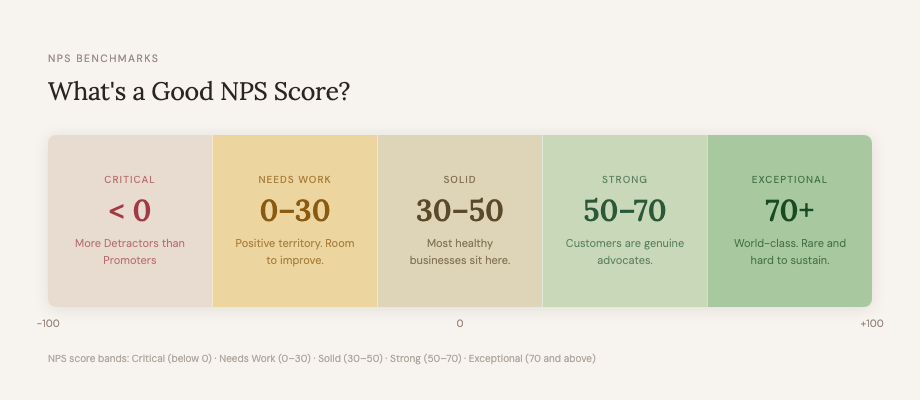
- Below 0 - more Detractors than Promoters. Needs urgent attention.
- 0–30 - positive territory. Room to improve.
- 30–50 - solid. Most healthy businesses sit here.
- 50–70 - strong. Customers are genuine advocates.
- Above 70 - exceptional. World-class. Rare and hard to sustain.
The more useful benchmark is your own score over time. A consistent upward trend matters more than hitting an industry average.
NPS vs CSAT - What's the Difference?
These two metrics are often confused because they both measure how customers feel. They're measuring different things.
NPS measures advocacy potential over time. It asks about future behaviour - would you recommend us? It's best measured at regular intervals, quarterly or after key milestones, to track trends.
CSAT measures satisfaction with a specific interaction. It asks "how satisfied were you with this experience?" right after a support conversation, a purchase, or an onboarding call. It's transactional and immediate.
| NPS | CSAT | |
|---|---|---|
| What it measures | Advocacy potential over time | Satisfaction with one interaction |
| When to use | Quarterly / relationship surveys | Post-interaction |
| Scale | 0–10 | Usually 1–5 or 1–10 |
| Formula | % Promoters − % Detractors | (Satisfied responses ÷ total) × 100 |
| Best for | Business health tracking | Frontline performance tracking |
| In Intercom | Not surfaced natively - needs a separate survey tool or integration | Built into conversation flow |
For support teams, CSAT is often the more actionable day-to-day metric - it tells you how individual conversations are landing. NPS tells you the bigger picture of whether customers trust you enough to recommend you.
The other key difference is what you can learn from each. NPS is a number attached to a relationship - it tells you sentiment, but not what drove it. CSAT is attached to a specific interaction, which means you have the full context of that conversation: what was asked, how it was handled, how long it took. That context is where the real learning happens - whether a score is good or bad, you can trace it back to something concrete and act on it.
The Biggest Limitation of NPS
NPS tells you how many customers would recommend you. It doesn't tell you why.
A score of 30 doesn't tell you whether customers love your product but hate your support, or love your support but find the product confusing, or whether the score is being dragged down by one specific customer segment.
This is why every NPS survey should include a follow-up open text question: "What's the main reason for your score?" The quantitative score gives you the headline. The qualitative responses give you the story behind it.
Other limitations worth knowing:
- Response bias - customers who bother to respond to surveys tend to have stronger opinions (positive or negative) than average customers
- Cultural variation - scoring habits vary by country; some cultures rarely give 9s or 10s regardless of how they feel
- Timing sensitivity - a survey sent right after a bad experience will produce a lower score than one sent a week later, even from the same customer
- Gaming - if teams are incentivised on NPS scores, there's a risk of survey timing manipulation
None of these make NPS useless. They're reasons to use it as one signal among several, not as the only metric you care about.
How to Actually Improve Your NPS
Tracking NPS is only useful if you act on what it tells you.
Close the loop with Detractors. Follow up personally with customers who gave you a low score. Not to defend yourself - to understand what went wrong and, where possible, fix it. A Detractor who gets a genuine response from a real person often becomes a Passive or even a Promoter.
Identify patterns in Detractor feedback. If the same theme keeps appearing in open-text responses - slow response times, a confusing feature, a billing issue - that's your highest-leverage area to fix.
If you're using Intercom, your conversation history is the most direct place to start. Pull up anyone who gave you a Detractor score and look at what interactions they've had - response times, how issues were handled, whether anything escalated. Matching NPS responses to conversation data gets you the why that the score alone doesn't provide.
Nurture Passives. Passives are the most overlooked group. They're one good experience away from becoming Promoters and one bad experience away from becoming Detractors. Proactive check-ins, new features that address their friction points, and personalised outreach all help move the needle.
Recognise what's working for Promoters. Ask Promoters what specifically drove their high score. The answer often reveals the parts of your product or service that are genuinely differentiated - things worth doubling down on.
Set a cadence. NPS is a trend metric. Run it quarterly at minimum so you're tracking direction, not just a snapshot.
NPS for Support Teams
If you run a customer support team, NPS is worth tracking at the relationship level - but CSAT is your more immediate feedback mechanism.
Support interactions have a disproportionate impact on NPS. Research consistently shows that a bad support experience is one of the top drivers of Detractor scores, even among customers who otherwise like the product. Conversely, a support team that resolves issues quickly and leaves customers feeling heard can turn a lukewarm customer into a Promoter.
The practical implication: tracking CSAT on individual conversations - noticing when satisfaction drops, acting on negative ratings in real time - is one of the most direct ways to protect and improve your overall NPS. Think of it this way: every support interaction is a micro-moment that feeds into how a customer ultimately feels about you.
If you're on Intercom, the CSAT side of this is already covered - conversation satisfaction ratings are surfaced natively and tied directly to individual tickets. What Intercom doesn't give you out of the box is NPS; for that you'll need a separate relationship survey, typically sent by email on a quarterly cadence. The two work well together: Intercom CSAT tells you how each conversation landed; your NPS survey tells you how that's showing up in overall customer sentiment.
CSAT is the daily homework grade. NPS is the report card.